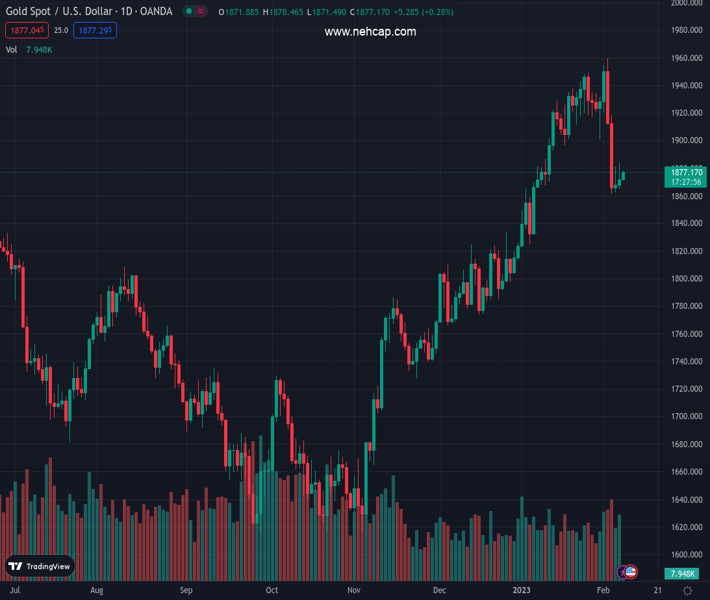
#XAUUSD @ 1,877.08 Gold price is aiming to recapture $1,880.00 as the risk appetite is improving. (Pivot Orderbook analysis)
…
This is a premium post.
[s2If !current_user_can(access_s2member_level4)]Please register for PREMIUM VERSION HERE to read full post below containing analysis. In case of any error or you think you are not able to read the full post below, please email us at support#nehcap.com [lwa][/s2If] [s2If current_user_can(access_s2member_level4)]
- Gold price is aiming to recapture $1,880.00 as the risk appetite is improving.
- Investors have shrugged-off uncertainty from Powell’s speech and US Biden’s SOTU meeting.
- The Fed might continue keeping rates higher for a longer period as the entire disinflationary process seems complicated.
The pair currently trades last at 1877.08.
The previous day high was 1884.49 while the previous day low was 1865.05. The daily 38.2% Fib levels comes at 1877.06, expected to provide support. Similarly, the daily 61.8% fib level is at 1872.48, expected to provide support.
Gold price (XAU/USD) is aiming to capture the immediate resistance of $1,880.00 in the Asian session. The precious metal rebounded after dropping to near $1870.00 and is expected to add gains ahead as the risk appetite of the market participants is improving.
Investors have digested the hawkish guidance on interest rates delivered by Federal Reserve (Fed) chair Jerome Powell and US President Joe Biden’s commentary at State of the Union (SOTU).
Fed chair Jerome Powell cleared that the central bank will hike interest rates further if the labor market report continues to surprise the market on the upside. The Fed is committed to bringing the inflation rate to 2% and therefore, higher interest rates will continue to stay for a longer horizon.
Meanwhile, US President Joe Biden sounded tough on China citing that “The United States is in strongest position from decades to compete with China or anyone else.”
Risk-perceived assets like S&P500 futures have ignored Powell’s hawkish commentary and US Biden’s tough statement on China and have recovered losses displayed in the Asian session, portraying a risk-on market mood. The US Dollar Index (DXY) is struggling to firm its feet and is expected to resume its downside journey. Also, the 10-year US Treasury yields have slipped to near 3.65%.
Gold price is forming an Inverted Flag chart pattern on a four-hour scale that indicates a sheer consolidation, which is followed by a breakdown in the same. Usually, the consolidation phase of the chart pattern serves as an inventory adjustment in which those participants initiate shorts, which prefer to enter an auction after the establishment of a bearish bias.
The Gold price is also struggling to sustain above the 23.6% Fibonacci retracement (placed from November 11 low at $1,617.32 to February 2 high at $1,959.20) at $1,878.00.
The 20-period Exponential Moving Average (EMA) at $1,882.20 is acting as a major barricade for the Gold price.
Meanwhile, the Relative Strength Index (RSI) (14) is struggling to cross 40.00, which indicates an absence of strength in the Gold bulls.
Technical Levels: Supports and Resistances
XAUUSD currently trading at 1876.48 at the time of writing. Pair opened at 1870.23 and is trading with a change of 0.33 % .
| Overview | Overview.1 | |
|---|---|---|
| 0 | Today last price | 1876.48 |
| 1 | Today Daily Change | 6.25 |
| 2 | Today Daily Change % | 0.33 |
| 3 | Today daily open | 1870.23 |
The pair is trading below its 20 Daily moving average @ 1913.83, above its 50 Daily moving average @ 1851.04 , above its 100 Daily moving average @ 1770.45 and above its 200 Daily moving average @ 1776.02
| Trends | Trends.1 | |
|---|---|---|
| 0 | Daily SMA20 | 1913.83 |
| 1 | Daily SMA50 | 1851.04 |
| 2 | Daily SMA100 | 1770.45 |
| 3 | Daily SMA200 | 1776.02 |
The previous day high was 1884.49 while the previous day low was 1865.05. The daily 38.2% Fib levels comes at 1877.06, expected to provide support. Similarly, the daily 61.8% fib level is at 1872.48, expected to provide support.
Note the levels of interest below:
- Pivot support is noted at 1862.02, 1853.82, 1842.58
- Pivot resistance is noted at 1881.46, 1892.7, 1900.9
| Levels | Levels.1 |
|---|---|
| Previous Daily High | 1884.49 |
| Previous Daily Low | 1865.05 |
| Previous Weekly High | 1959.80 |
| Previous Weekly Low | 1861.45 |
| Previous Monthly High | 1949.27 |
| Previous Monthly Low | 1823.76 |
| Daily Fibonacci 38.2% | 1877.06 |
| Daily Fibonacci 61.8% | 1872.48 |
| Daily Pivot Point S1 | 1862.02 |
| Daily Pivot Point S2 | 1853.82 |
| Daily Pivot Point S3 | 1842.58 |
| Daily Pivot Point R1 | 1881.46 |
| Daily Pivot Point R2 | 1892.70 |
| Daily Pivot Point R3 | 1900.90 |
[/s2If]
Join Our Telegram Group
")


