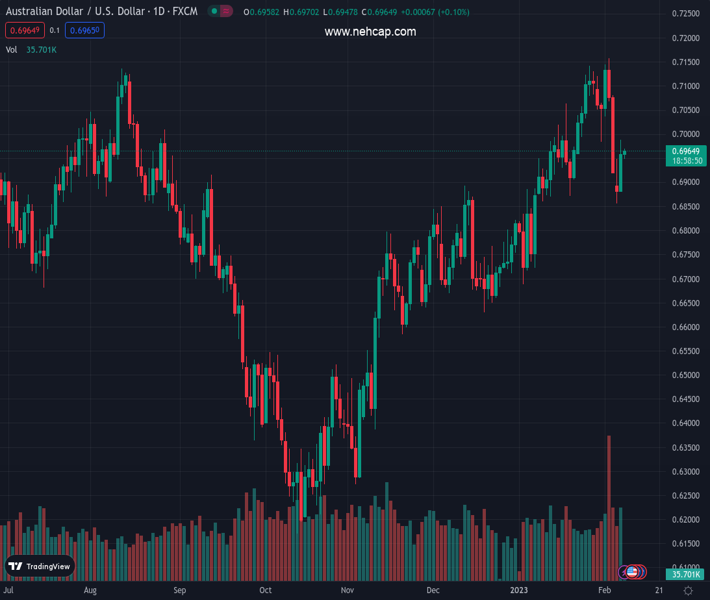
#AUDUSD @ 0.69645 clings to mild gains during two-day rebound from monthly low., @nehcap view: Further upside expected (Pivot Orderbook analysis)
…
This is a premium post.
[s2If !current_user_can(access_s2member_level4)]Please register for PREMIUM VERSION HERE to read full post below containing analysis. In case of any error or you think you are not able to read the full post below, please email us at support#nehcap.com [lwa][/s2If] [s2If current_user_can(access_s2member_level4)]
- AUD/USD clings to mild gains during two-day rebound from monthly low.
- Sustained break of 200-EMA joins upbeat oscillators to favor buyers.
- Two-week-old horizontal resistance area challenges immediate upside while ascending trend line from late December probes bears.
The pair currently trades last at 0.69645.
The previous day high was 0.6989 while the previous day low was 0.6879. The daily 38.2% Fib levels comes at 0.6947, expected to provide support. Similarly, the daily 61.8% fib level is at 0.6921, expected to provide support.
AUD/USD holds onto the previous day’s recovery moves near 0.6960 as buyers keep the reins on crossing the 200-bar Exponential Moving Average (EMA) during early Wednesday. In doing so, the Aussie pair marches towards a fortnight-old horizontal resistance region amid bullish signals from MACD and a gradual rise in the RSI (14) line.
That said, the risk-barometer pair is likely to overcome the immediate hurdle surrounding the 0.7000 psychological magnet. However, an area comprising multiple levels marked since January 18, close to 0.7060 could challenge the AUD/USD buyers afterward.
In a case where the AUD/USD price remains firmer past 0.7060, a run-up towards the 0.7100 round figure and then to the monthly high surrounding 0.7160 can’t be ruled out.
It should be noted that the Aussie pair’s successful rise above 0.7160 could challenge June 2022 high near 0.7285.
Meanwhile, AUD/USD bears aren’t safe if they take entries on the quote’s fresh downside below the 200-EMA, around 0.6935.
The reason could be linked to the quote’s multiple bounces off an upward-sloping support line from late December 2022, close to 0.6865 at the latest. Following that, the monthly low of 0.6855 may act as the last defense of the AUD/USD bulls.
Trend: Further upside expected
Technical Levels: Supports and Resistances
AUDUSD currently trading at 0.6961 at the time of writing. Pair opened at 0.6951 and is trading with a change of 0.14% % .
| Overview | Overview.1 | |
|---|---|---|
| 0 | Today last price | 0.6961 |
| 1 | Today Daily Change | 0.0010 |
| 2 | Today Daily Change % | 0.14% |
| 3 | Today daily open | 0.6951 |
The pair is trading below its 20 Daily moving average @ 0.7005, above its 50 Daily moving average @ 0.6862 , above its 100 Daily moving average @ 0.6674 and above its 200 Daily moving average @ 0.6809
| Trends | Trends.1 | |
|---|---|---|
| 0 | Daily SMA20 | 0.7005 |
| 1 | Daily SMA50 | 0.6862 |
| 2 | Daily SMA100 | 0.6674 |
| 3 | Daily SMA200 | 0.6809 |
The previous day high was 0.6989 while the previous day low was 0.6879. The daily 38.2% Fib levels comes at 0.6947, expected to provide support. Similarly, the daily 61.8% fib level is at 0.6921, expected to provide support.
Note the levels of interest below:
- Pivot support is noted at 0.6891, 0.683, 0.6781
- Pivot resistance is noted at 0.7, 0.7049, 0.7109
| Levels | Levels.1 |
|---|---|
| Previous Daily High | 0.6989 |
| Previous Daily Low | 0.6879 |
| Previous Weekly High | 0.7158 |
| Previous Weekly Low | 0.6919 |
| Previous Monthly High | 0.7143 |
| Previous Monthly Low | 0.6688 |
| Daily Fibonacci 38.2% | 0.6947 |
| Daily Fibonacci 61.8% | 0.6921 |
| Daily Pivot Point S1 | 0.6891 |
| Daily Pivot Point S2 | 0.6830 |
| Daily Pivot Point S3 | 0.6781 |
| Daily Pivot Point R1 | 0.7000 |
| Daily Pivot Point R2 | 0.7049 |
| Daily Pivot Point R3 | 0.7109 |
[/s2If]
Join Our Telegram Group
")


