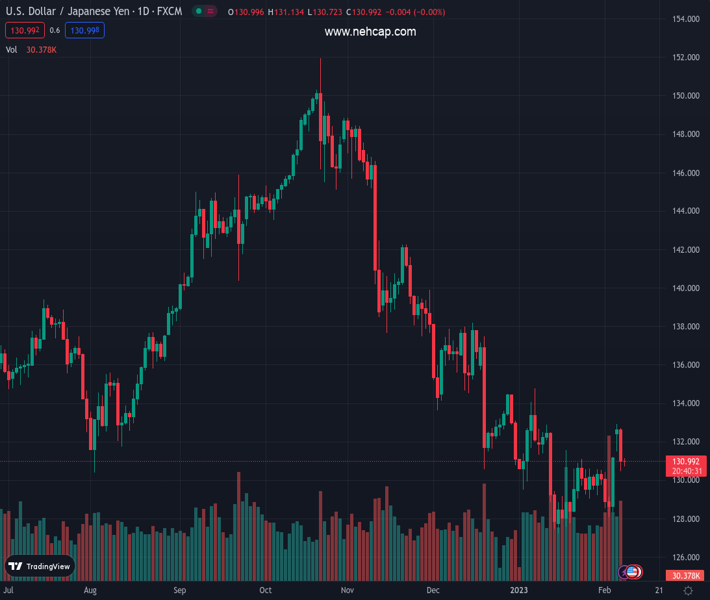
#USDJPY @ 130.957 extends the previous day’s bearish momentum with a slower pace. (Pivot Orderbook analysis)
…
This is a premium post.
[s2If !current_user_can(access_s2member_level4)]Please register for PREMIUM VERSION HERE to read full post below containing analysis. In case of any error or you think you are not able to read the full post below, please email us at support#nehcap.com [lwa][/s2If] [s2If current_user_can(access_s2member_level4)]
- USD/JPY extends the previous day’s bearish momentum with a slower pace.
- US Treasury bond yields ease amid mixed news, unimpressive Fed talks and Japan trade numbers.
- Market sentiment remains sluggish as traders await US President Biden’s SOTU.
The pair currently trades last at 130.957.
The previous day high was 132.71 while the previous day low was 130.48. The daily 38.2% Fib levels comes at 131.33, expected to provide resistance. Similarly, the daily 61.8% fib level is at 131.86, expected to provide resistance.
USD/JPY stays pressured around 130.90 while extending the previous day’s pullback from the highest level in a month. In doing so, the Yen pair tracks the recent weakness in the US Treasury bond yields amid the sluggish start of Wednesday’s Tokyo trading. It’s worth noting that mixed Japan data and Fedspeak joins geopolitical concerns to weigh on the quote of late.
US 10-year Treasury bond yields snap a three-day uptrend while retreating from a one-month high of around 3.68% to 3.67% by the press time. The same weigh on the US Dollar Index (DXY), down for the second consecutive day to near 103.30 at the latest. That said, the S&P 500 Futures print mild losses to track Wall Street and portray downbeat sentiment.
Japan’s trade deficit eased to ¥-1,225.6B versus ¥-1,814.6B expected and ¥-1,537.8B prior but the Current Account balance softened to ¥33.4B from ¥1,803.6B previous readings and ¥98.4B.
Elsewhere, Minneapolis Federal Reserve (Fed) President Neel Kashkari told CNN, “We may have to hold rates at a higher level for longer,” while adding that he is not forecasting a recession. Following that, Federal Reserve Chairman Jerome Powell said, “Expect 2023 to be a year of significant declines in inflation,” while also adding that if data were to continue to come in stronger than expected, would certainly raise rates more.
It should be noted that optimism surrounding the Japanese government’s wage talks to labor representatives, during March, seems to have favored the optimism at home. However, China’s rejection of the Pentagon’s request keeps the geopolitical tension high.
Looking forward, USD/JPY pair traders should rely on the Bank of Japan (BoJ) talks to aim for further downside, especially amid recent hawkish concerns surrounding the Japanese central bank. Also important to watch will be today’s State of the Union (SOTU) speech from United States President Joe Biden. “US President Joe Biden will face Republicans who question his legitimacy and a public concerned about the country’s direction in Tuesday’s State of the Union speech that is expected to serve as a blueprint for a 2024 re-election bid,” said Reuters ahead of the event.
A U-turn from the 50-DMA, around 132.40 at the latest, directs USD/JPY towards the 130.00 round figure.
Technical Levels: Supports and Resistances
USDJPY currently trading at 130.89 at the time of writing. Pair opened at 131.09 and is trading with a change of -0.15% % .
| Overview | Overview.1 | |
|---|---|---|
| 0 | Today last price | 130.89 |
| 1 | Today Daily Change | -0.20 |
| 2 | Today Daily Change % | -0.15% |
| 3 | Today daily open | 131.09 |
The pair is trading above its 20 Daily moving average @ 129.84, below its 50 Daily moving average @ 132.53 , below its 100 Daily moving average @ 138.55 and below its 200 Daily moving average @ 136.8
| Trends | Trends.1 | |
|---|---|---|
| 0 | Daily SMA20 | 129.84 |
| 1 | Daily SMA50 | 132.53 |
| 2 | Daily SMA100 | 138.55 |
| 3 | Daily SMA200 | 136.80 |
The previous day high was 132.71 while the previous day low was 130.48. The daily 38.2% Fib levels comes at 131.33, expected to provide resistance. Similarly, the daily 61.8% fib level is at 131.86, expected to provide resistance.
Note the levels of interest below:
- Pivot support is noted at 130.14, 129.19, 127.9
- Pivot resistance is noted at 132.38, 133.66, 134.61
| Levels | Levels.1 |
|---|---|
| Previous Daily High | 132.71 |
| Previous Daily Low | 130.48 |
| Previous Weekly High | 131.20 |
| Previous Weekly Low | 128.08 |
| Previous Monthly High | 134.78 |
| Previous Monthly Low | 127.22 |
| Daily Fibonacci 38.2% | 131.33 |
| Daily Fibonacci 61.8% | 131.86 |
| Daily Pivot Point S1 | 130.14 |
| Daily Pivot Point S2 | 129.19 |
| Daily Pivot Point S3 | 127.90 |
| Daily Pivot Point R1 | 132.38 |
| Daily Pivot Point R2 | 133.66 |
| Daily Pivot Point R3 | 134.61 |
[/s2If]
Join Our Telegram Group
")


