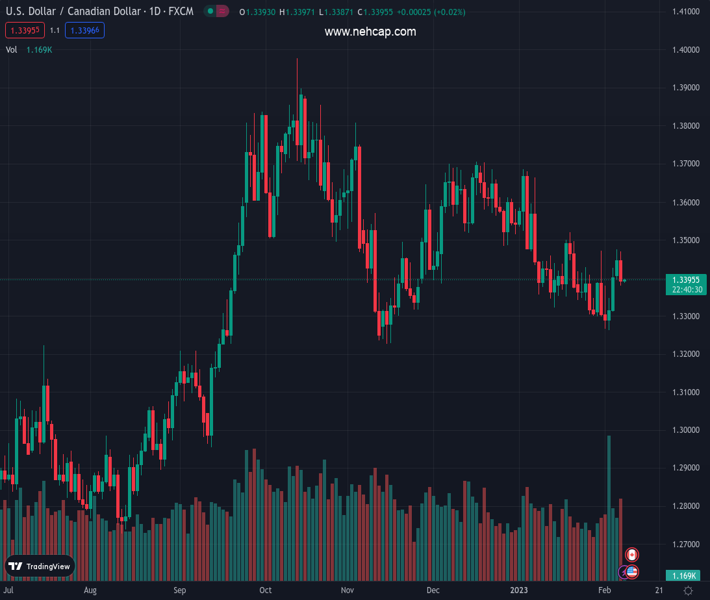
#USDCAD @ 1.33963 has slipped below the 20-period EMA amid risk-on mood and the higher oil price. (Pivot Orderbook analysis)
…
This is a premium post.
[s2If !current_user_can(access_s2member_level4)]Please register for PREMIUM VERSION HERE to read full post below containing analysis. In case of any error or you think you are not able to read the full post below, please email us at support#nehcap.com [lwa][/s2If] [s2If current_user_can(access_s2member_level4)]
- USD/CAD has slipped below the 20-period EMA amid risk-on mood and the higher oil price.
- Fed Powell’s hawkish commentary failed to infuse blood into the safe-haven assets.
- A Fakeout of the Falling Channel pattern has trimmed demand for the US Dollar.
The pair currently trades last at 1.33963.
The previous day high was 1.3476 while the previous day low was 1.3397. The daily 38.2% Fib levels comes at 1.3446, expected to provide resistance. Similarly, the daily 61.8% fib level is at 1.3427, expected to provide resistance.
The USD/CAD pair has dropped vertically below the crucial support of 1.3400 in the early Tokyo session. The Loonie asset is facing immense pressure amid a decline in the US Dollar Index (DXY) and a sheer recovery in the oil price. The USD Index showed immense volatility despite Federal Reserve (Fed) chair Jerome Powell favors for a continuation of interest rate hikes after a stronger-than-expected January United States Nonfarm Payrolls (NFP) report.
Risk-perceived assets like S&P500 settled Tuesday’s session on a bullish note supported by tech-savvy stocks, portraying that the risk appetite theme is in traction. The alpha generated by 10-year US Treasury bonds has surged to near 3.68%.
USD/CAD sensed the presence of sheer selling pressure after an attempt of delivering a breakout of the Falling Channel chart pattern on a two-hour scale. The formation of a Fakeout pushed the asset below the 20-period Exponential Moving Average (EMA) around 1.3414, which indicates that the short-term trend is bearish.
The Relative Strength Index (RSI) (14) has shifted into the 40.00-60.00 range from the bullish range of 60.00-80.00, which indicates that the bullish view has been negated for now.
The bullish view for the US Dollar was negated after a failure in delivering a Falling Channel breakout, which has exposed the loonie for a downside till January 3 low at 1.3321 and February 2 low at 1.3262 as the asset has slipped below the round-level support of 1.3400.
In an alternative scenario, a break Above February 7 high at 1.3469 will drive the asset toward January 19 high at 1.3521 followed by January 6 low at 1.3538.
Technical Levels: Supports and Resistances
USDCAD currently trading at 1.34 at the time of writing. Pair opened at 1.3443 and is trading with a change of -0.32 % .
| Overview | Overview.1 | |
|---|---|---|
| 0 | Today last price | 1.3400 |
| 1 | Today Daily Change | -0.0043 |
| 2 | Today Daily Change % | -0.3200 |
| 3 | Today daily open | 1.3443 |
The pair is trading above its 20 Daily moving average @ 1.3383, below its 50 Daily moving average @ 1.3498 , below its 100 Daily moving average @ 1.3536 and above its 200 Daily moving average @ 1.3225
| Trends | Trends.1 | |
|---|---|---|
| 0 | Daily SMA20 | 1.3383 |
| 1 | Daily SMA50 | 1.3498 |
| 2 | Daily SMA100 | 1.3536 |
| 3 | Daily SMA200 | 1.3225 |
The previous day high was 1.3476 while the previous day low was 1.3397. The daily 38.2% Fib levels comes at 1.3446, expected to provide resistance. Similarly, the daily 61.8% fib level is at 1.3427, expected to provide resistance.
Note the levels of interest below:
- Pivot support is noted at 1.3401, 1.3359, 1.3322
- Pivot resistance is noted at 1.348, 1.3517, 1.3559
| Levels | Levels.1 |
|---|---|
| Previous Daily High | 1.3476 |
| Previous Daily Low | 1.3397 |
| Previous Weekly High | 1.3472 |
| Previous Weekly Low | 1.3262 |
| Previous Monthly High | 1.3685 |
| Previous Monthly Low | 1.3300 |
| Daily Fibonacci 38.2% | 1.3446 |
| Daily Fibonacci 61.8% | 1.3427 |
| Daily Pivot Point S1 | 1.3401 |
| Daily Pivot Point S2 | 1.3359 |
| Daily Pivot Point S3 | 1.3322 |
| Daily Pivot Point R1 | 1.3480 |
| Daily Pivot Point R2 | 1.3517 |
| Daily Pivot Point R3 | 1.3559 |
[/s2If]
Join Our Telegram Group
")


