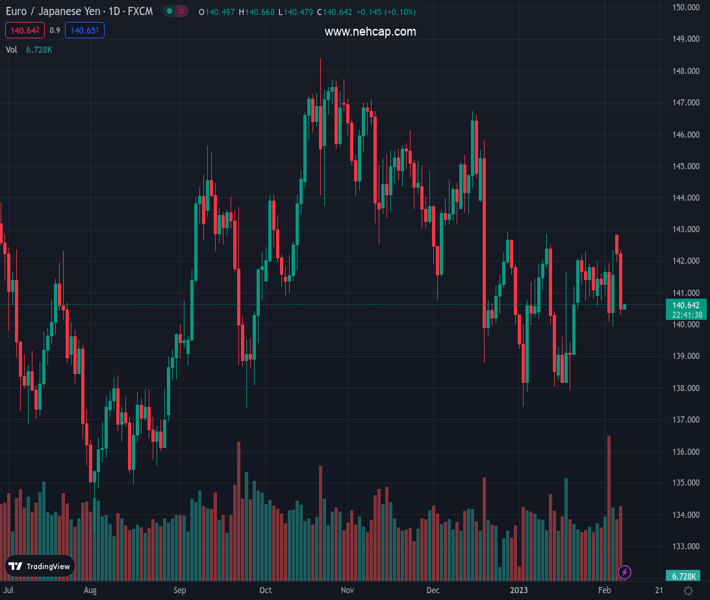
#EURJPY @ 140.651 The cut last Friday’s gains, dropping towards the 200-day EMA, as sellers target 140.00 and below. (Pivot Orderbook analysis)
…
This is a premium post.
[s2If !current_user_can(access_s2member_level4)]Please register for PREMIUM VERSION HERE to read full post below containing analysis. In case of any error or you think you are not able to read the full post below, please email us at support#nehcap.com [lwa][/s2If] [s2If current_user_can(access_s2member_level4)]
- The EUR/JPY cut last Friday’s gains, dropping towards the 200-day EMA, as sellers target 140.00 and below.
- EUR/JPY Price Analysis: The pullback towards the 200-DMA might pave the way for a deeper correction before resuming the uptrend.
The pair currently trades last at 140.651.
The previous day high was 142.88 while the previous day low was 141.59. The daily 38.2% Fib levels comes at 142.39, expected to provide resistance. Similarly, the daily 61.8% fib level is at 142.08, expected to provide resistance.
EUR/JPY continued to trade lower for two consecutive days, retracing most of last Friday’s gains, and reclaimed the 50 and 20-day Exponential Moving Averages (EMAs), on its way south. The Euro’s (EUR) collapse was capped by the trend-setter 200-day EMA at 140.30, though it would likely remain under pressure. At the time of writing, the EUR/JPY is trading at 140.52, with losses of 1.20%, as Tuesday’s session ends.
The EUR/JPY shifted to neutral from neutral-upwards, according to the daily chart, following Tuesday’s fall beneath essential demand zones. In addition, the EUR/JPY pair could turn neutral downwards as the spot price hovers nearby the 200-day EMA, which, once cleared, could pave the way for further losses.
The Relative Strength Index (RSI) and the Rate of Change (RoC) supported the above-mentioned scenario, meaning that in the short term, the EUR/JPY might pull back before resuming its uptrend.
Therefore, the EUR/JPY first support would be the 200-day EMA at 140.30. A breach of the latter will send the pair sliding towards the 140.00 figure, which, once cleared, the EUR/JPY might fall toward the January 20 daily low of 139.03.
As an alternate scenario and the current trend, the EUR/JPY first resistance would be the 20-day EMA at 141.03. A break of that supply zone and the EUR/JPY might rally toward the psychological 142.00 area followed by the February 7 high fo 142.33.
Technical Levels: Supports and Resistances
EURJPY currently trading at 140.56 at the time of writing. Pair opened at 142.3 and is trading with a change of -1.22 % .
| Overview | Overview.1 | |
|---|---|---|
| 0 | Today last price | 140.56 |
| 1 | Today Daily Change | -1.74 |
| 2 | Today Daily Change % | -1.22 |
| 3 | Today daily open | 142.30 |
The pair remains strongly bearish on the daily time frame. It trades below the 20 SMA @ 140.83, 50 SMA 141.73, 100 SMA @ 142.97 and 200 SMA @ 141.01.
| Trends | Trends.1 | |
|---|---|---|
| 0 | Daily SMA20 | 140.83 |
| 1 | Daily SMA50 | 141.73 |
| 2 | Daily SMA100 | 142.97 |
| 3 | Daily SMA200 | 141.01 |
The previous day high was 142.88 while the previous day low was 141.59. The daily 38.2% Fib levels comes at 142.39, expected to provide resistance. Similarly, the daily 61.8% fib level is at 142.08, expected to provide resistance.
Note the levels of interest below:
- Pivot support is noted at 141.63, 140.97, 140.35
- Pivot resistance is noted at 142.92, 143.54, 144.2
| Levels | Levels.1 |
|---|---|
| Previous Daily High | 142.88 |
| Previous Daily Low | 141.59 |
| Previous Weekly High | 142.34 |
| Previous Weekly Low | 139.93 |
| Previous Monthly High | 142.86 |
| Previous Monthly Low | 137.39 |
| Daily Fibonacci 38.2% | 142.39 |
| Daily Fibonacci 61.8% | 142.08 |
| Daily Pivot Point S1 | 141.63 |
| Daily Pivot Point S2 | 140.97 |
| Daily Pivot Point S3 | 140.35 |
| Daily Pivot Point R1 | 142.92 |
| Daily Pivot Point R2 | 143.54 |
| Daily Pivot Point R3 | 144.20 |
[/s2If]
Join Our Telegram Group
")


