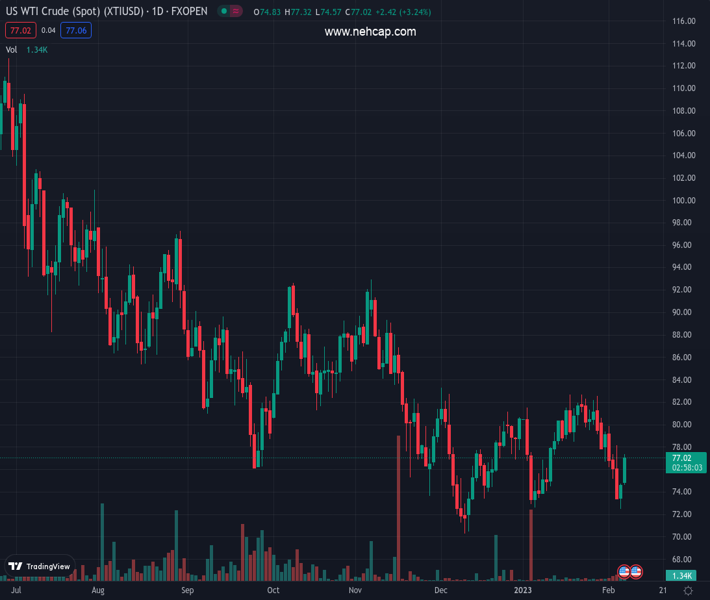
Western Texas Intermediate got bolstered as the US Dollar weakens on soft US Fed Powell remarks (Pivot Orderbook analysis)
…
This is a premium post.
[s2If !current_user_can(access_s2member_level4)]Please register for PREMIUM VERSION HERE to read full post below containing analysis. In case of any error or you think you are not able to read the full post below, please email us at support#nehcap.com [lwa][/s2If] [s2If current_user_can(access_s2member_level4)]
- Western Texas Intermediate got bolstered as the US Dollar weakens on soft US Fed Powell remarks
- China’s reopening and Turkey’s earthquake are one of the multiple factors underpinning oil prices.
- WTI Technical Analysis: Range-bound, but it could test $78.00 PB in the short term.
The pair currently trades last at 76.73.
The previous day high was 74.68 while the previous day low was 72.5. The daily 38.2% Fib levels comes at 73.85, expected to provide support. Similarly, the daily 61.8% fib level is at 73.34, expected to provide support.
The US crude oil benchmark, also known as Western Texas Intermediate (WTI), advances sharply as the US Dollar (USD) weakens, as the US Federal Reserve (Fed) Chair Jerome Powell speaks at the Economic Club of Washington. At the time of writing, WTI is trading at $76.50 PB.
Wall Street turned green as Fed Chair Jerome Powell failed to pushback against the last week’s astonishing employment report in the United States (US), which spurred a market’s reaction, sending the US Dollar soaring and US Treasury bond yields jumping more than 20 bps, namely the 10-year benchmark note rate.
However, the US Dollar Index (DXY) is falling 0.35%, down at 103.264, sparking an upward reaction in WTI, hovering around the 20-day Exponential Moving Average (EMA) at $77.61.
Additional factors influencing oil prices are optimism about China’s reopening, and worries about supply shortages as a major export terminal in Turkey was shut down following an earthquake in the country.
China’s reopening following the relaxation of the Covid-19 zero-tolerance policy augmented speculations that oil demand would increase during 2023. Even the International Energy Agency (IEA) estimates that half of 2023 global oil demand will come from China.
Meanwhile, operations at Ceyhan, Turkey’s main oil export terminal, were shut after an earthquake hit the region. The terminal will remain closed until February 8.
WTI is trading sideways after the US Federal Reserve Chair Jerome Powell finished its speech. It should be said that WTI broke to new daily highs of $77.11 on dovish remarks by Powell, weakening the US Dollar. Nevertheless, oil failed to gain traction and clear the 20-day EMA at $77.58, which could’ve exposed last Friday’s high at $77.96. Break above and the $78.00 figure is up for grabs.
On the flip side, WTI’s first support would be $74.40, which, once cleared could pave the way for further downside.
Technical Levels: Supports and Resistances
XTIUSD currently trading at 76.73 at the time of writing. Pair opened at 74.65 and is trading with a change of 2.79 % .
| Overview | Overview.1 | |
|---|---|---|
| 0 | Today last price | 76.73 |
| 1 | Today Daily Change | 2.08 |
| 2 | Today Daily Change % | 2.79 |
| 3 | Today daily open | 74.65 |
The pair remains strongly bearish on the daily time frame. It trades below the 20 SMA @ 78.79, 50 SMA 77.61, 100 SMA @ 81.01 and 200 SMA @ 90.63.
| Trends | Trends.1 | |
|---|---|---|
| 0 | Daily SMA20 | 78.79 |
| 1 | Daily SMA50 | 77.61 |
| 2 | Daily SMA100 | 81.01 |
| 3 | Daily SMA200 | 90.63 |
The previous day high was 74.68 while the previous day low was 72.5. The daily 38.2% Fib levels comes at 73.85, expected to provide support. Similarly, the daily 61.8% fib level is at 73.34, expected to provide support.
Note the levels of interest below:
- Pivot support is noted at 73.21, 71.77, 71.03
- Pivot resistance is noted at 75.39, 76.13, 77.57
| Levels | Levels.1 |
|---|---|
| Previous Daily High | 74.68 |
| Previous Daily Low | 72.50 |
| Previous Weekly High | 80.61 |
| Previous Weekly Low | 73.36 |
| Previous Monthly High | 82.68 |
| Previous Monthly Low | 72.64 |
| Daily Fibonacci 38.2% | 73.85 |
| Daily Fibonacci 61.8% | 73.34 |
| Daily Pivot Point S1 | 73.21 |
| Daily Pivot Point S2 | 71.77 |
| Daily Pivot Point S3 | 71.03 |
| Daily Pivot Point R1 | 75.39 |
| Daily Pivot Point R2 | 76.13 |
| Daily Pivot Point R3 | 77.57 |
[/s2If]
Join Our Telegram Group
")


