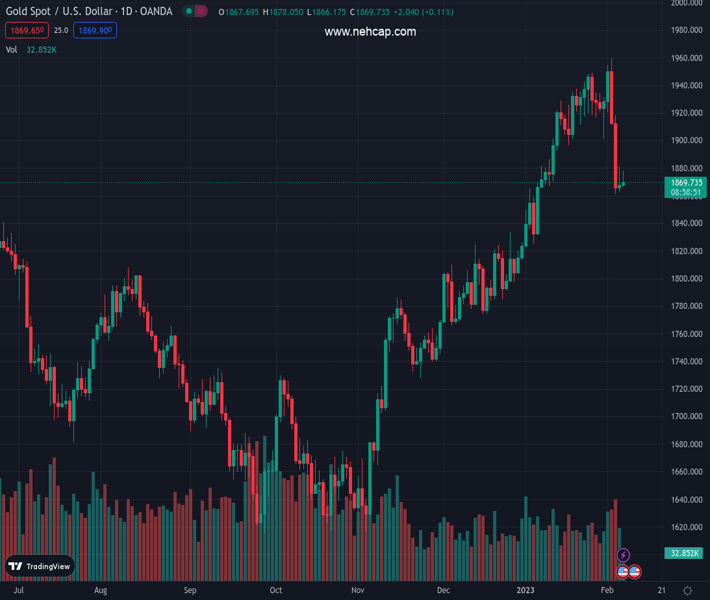
#XAUUSD @ 1,870.63 Gold price struggles to capitalize on its modest intraday uptick and hangs near a one-month low. (Pivot Orderbook analysis)
…
This is a premium post.
[s2If !current_user_can(access_s2member_level4)]Please register for PREMIUM VERSION HERE to read full post below containing analysis. In case of any error or you think you are not able to read the full post below, please email us at support#nehcap.com [lwa][/s2If] [s2If current_user_can(access_s2member_level4)]
- Gold price struggles to capitalize on its modest intraday uptick and hangs near a one-month low.
- Expectations that the Federal Reserve will stick to its hawkish stance seem to cap the XAU/USD.
- Subdued US Dollar price action lends some support ahead of Fed Chair Jerome Powell’s speech.
The pair currently trades last at 1870.63.
The previous day high was 1881.39 while the previous day low was 1860.3. The daily 38.2% Fib levels comes at 1873.33, expected to provide resistance. Similarly, the daily 61.8% fib level is at 1868.36, expected to provide support.
Gold price edges higher for the second straight day on Tuesday, albeit seems to struggle to capitalize on the modest intraday gains. The XAU/USD trades around the $1,872-$1,873 region heading into the North American session and remains close to a one-month low touched on Monday.
The US Dollar (USD) stalls its recent strong recovery move from a nine-month low and turns out to be a key factor lending some support to the Gold price. The downside for the USD, however, seems cushioned amid expectations that the Federal Reserve (Fed) will stick to its hawkish stance for longer. This, in turn, keeps a lid on any meaningful upside for the US Dollar-denominated commodity.
The latest monthly employment details from the United States (US) released last Friday pointed to the underlying strength in the labor market and could allow the Fed to continue raising interest rates. This, in turn, pushes the US Treasury bond yields higher and acts as a tailwind for the Greenback, capping gains for the non-yielding Gold price, at least for the time being.
Traders also seem reluctant to place aggressive bets ahead of Fed Chair Jerome Powell’s appearance later during the US session. Powell’s comments on inflation and monetary policy might influence market expectations about the Fed’s rate-hike path. This, in turn, will play a key role in influencing the near-term USD price dynamics and provide a fresh directional impetus to Gold price.
In the meantime, the XAU/USD seems more likely to extend its sideways consolidative price move in the absence of any relevant market-moving economic releases from the US. Hence, it will be prudent to wait for strong follow-through buying before confirming that the recent sharp pullback from the highest level since April 2022 has run its course and positioning for additional gains.
From a technical perspective, the lack of any meaningful buying suggests that the recent downfall in Gold price might still be far from being over. Moreover, oscillators on the daily chart have just started drifting into negative territory and are still far from being in the oversold zone. This, in turn, supports prospects for a further near-term depreciating move. That said, it will be prudent to wait for some follow-through selling below the multi-week low, around the $1,860 region, before placing fresh bearish bets.
Gold price could then accelerate the fall towards the $1,825 horizontal support en route to the $1,800 round-figure mark. This is followed by the very important 200-day Simple Moving Average (SMA), currently around the $1,776-$1,775 area. The latter should act as a pivotal point, which if broken decisively will be seen as a fresh trigger for bearish traders set the stage for a deeper corrective decline.
On the flip side, any meaningful upside is likely to confront some resistance near the $1,890-$1.892 zone ahead of the $1,900 mark. A sustained strength beyond has the potential to lift the Gold price to the $1,920 horizontal barrier, above which a bout of a short-covering move could push the XAU/USD towards the $1,950 region. This is closely followed by the multi-month peak, around the $1,960 area touched last week.
Technical Levels: Supports and Resistances
XAUUSD currently trading at 1871.97 at the time of writing. Pair opened at 1868.5 and is trading with a change of 0.19 % .
| Overview | Overview.1 | |
|---|---|---|
| 0 | Today last price | 1871.97 |
| 1 | Today Daily Change | 3.47 |
| 2 | Today Daily Change % | 0.19 |
| 3 | Today daily open | 1868.50 |
The pair is trading below its 20 Daily moving average @ 1914.22, above its 50 Daily moving average @ 1848.61 , above its 100 Daily moving average @ 1768.4 and above its 200 Daily moving average @ 1776.01
| Trends | Trends.1 | |
|---|---|---|
| 0 | Daily SMA20 | 1914.22 |
| 1 | Daily SMA50 | 1848.61 |
| 2 | Daily SMA100 | 1768.40 |
| 3 | Daily SMA200 | 1776.01 |
The previous day high was 1881.39 while the previous day low was 1860.3. The daily 38.2% Fib levels comes at 1873.33, expected to provide resistance. Similarly, the daily 61.8% fib level is at 1868.36, expected to provide support.
Note the levels of interest below:
- Pivot support is noted at 1858.74, 1848.97, 1837.65
- Pivot resistance is noted at 1879.83, 1891.15, 1900.92
| Levels | Levels.1 |
|---|---|
| Previous Daily High | 1881.39 |
| Previous Daily Low | 1860.30 |
| Previous Weekly High | 1959.80 |
| Previous Weekly Low | 1861.45 |
| Previous Monthly High | 1949.27 |
| Previous Monthly Low | 1823.76 |
| Daily Fibonacci 38.2% | 1873.33 |
| Daily Fibonacci 61.8% | 1868.36 |
| Daily Pivot Point S1 | 1858.74 |
| Daily Pivot Point S2 | 1848.97 |
| Daily Pivot Point S3 | 1837.65 |
| Daily Pivot Point R1 | 1879.83 |
| Daily Pivot Point R2 | 1891.15 |
| Daily Pivot Point R3 | 1900.92 |
[/s2If]
Join Our Telegram Group
")


