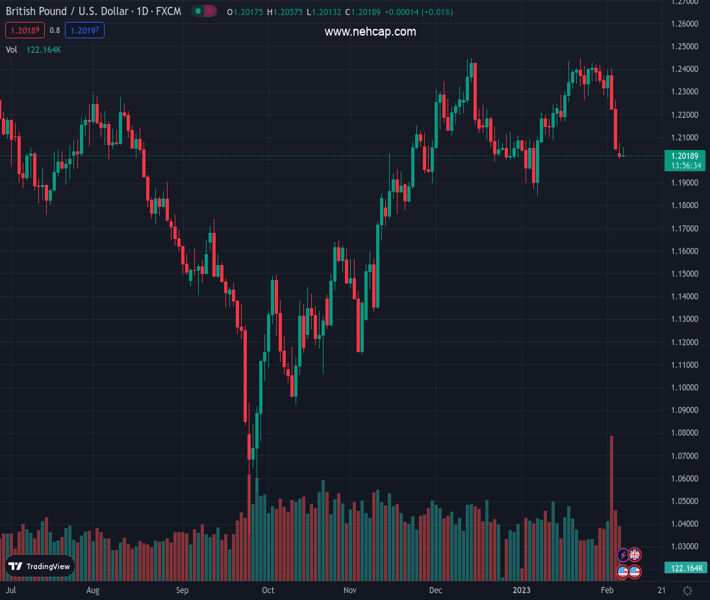
#GBPUSD @ 1.20220 struggles to capitalize on its modest intraday bounce from a one-month low. (Pivot Orderbook analysis)
…
This is a premium post.
[s2If !current_user_can(access_s2member_level4)]Please register for PREMIUM VERSION HERE to read full post below containing analysis. In case of any error or you think you are not able to read the full post below, please email us at support#nehcap.com [lwa][/s2If] [s2If current_user_can(access_s2member_level4)]
- GBP/USD struggles to capitalize on its modest intraday bounce from a one-month low.
- Hawkish Fed expectations help limit the downside for the USD and act as a headwind.
- Speculations that the current BoE rate-hiking cycle is nearing the end contribute to cap.
The pair currently trades last at 1.20220.
The previous day high was 1.2078 while the previous day low was 1.2006. The daily 38.2% Fib levels comes at 1.2033, expected to provide resistance. Similarly, the daily 61.8% fib level is at 1.205, expected to provide resistance.
The GBP/USD pair attracts some buyers near the 1.2000 psychological mark on Tuesday and snaps a three-day losing streak to a one-month low touched the previous day. Spot prices, however, trim a part of the modest intraday gains and retreat to the 1.2025 region during the early European session.
The upbeat US monthly jobs data inspired strong US Dollar recovery momentum from a nine-month low set on Friday stalls amid a modest downtick in the US Treasury bond yields. This is seen as a key factor lending some support to the GBP/USD pair. That said, any meaningful recovery seems elusive, warranting some caution for aggressive bullish traders.
Investors now seem convinced that the Federal Reserve will stick to its hawkish stance for longer and the bets were reaffirmed by the blockbuster US NFP report on Friday. This should act as a tailwind for the US bond yields and lend some support to the USD, which, in turn, should keep a lid on the GBP/USD pair, at least for the time being.
Furthermore, a dovish assessment of the Bank of England (BoE) policy decision last week suggests that the path of least resistance for the GBP/USD pair is the downside. In fact, BoE Governor Andrew Bailey said that inflation will continue to fall this year and more rapidly during the second half of 2023. This raises speculations that the current rate-hiking cycle might be nearing the end and adds credence to the near-term bearish outlook.
Moving ahead, there isn’t any relevant market-moving economic data due for release on Tuesday, either from the UK or the US. Hence, the focus will be on Fed Chair Jerome Powell’s speech later during the US session. This, along with the US bond yields and the broader risk sentiment, will influence the USD and provide some impetus to the GBP/USD pair.
Technical Levels: Supports and Resistances
GBPUSD currently trading at 1.2028 at the time of writing. Pair opened at 1.2023 and is trading with a change of 0.04 % .
| Overview | Overview.1 | |
|---|---|---|
| 0 | Today last price | 1.2028 |
| 1 | Today Daily Change | 0.0005 |
| 2 | Today Daily Change % | 0.0400 |
| 3 | Today daily open | 1.2023 |
The pair is trading below its 20 Daily moving average @ 1.2281, below its 50 Daily moving average @ 1.2191 , above its 100 Daily moving average @ 1.181 and above its 200 Daily moving average @ 1.1953
| Trends | Trends.1 | |
|---|---|---|
| 0 | Daily SMA20 | 1.2281 |
| 1 | Daily SMA50 | 1.2191 |
| 2 | Daily SMA100 | 1.1810 |
| 3 | Daily SMA200 | 1.1953 |
The previous day high was 1.2078 while the previous day low was 1.2006. The daily 38.2% Fib levels comes at 1.2033, expected to provide resistance. Similarly, the daily 61.8% fib level is at 1.205, expected to provide resistance.
Note the levels of interest below:
- Pivot support is noted at 1.1993, 1.1964, 1.1922
- Pivot resistance is noted at 1.2065, 1.2107, 1.2137
| Levels | Levels.1 |
|---|---|
| Previous Daily High | 1.2078 |
| Previous Daily Low | 1.2006 |
| Previous Weekly High | 1.2418 |
| Previous Weekly Low | 1.2050 |
| Previous Monthly High | 1.2448 |
| Previous Monthly Low | 1.1841 |
| Daily Fibonacci 38.2% | 1.2033 |
| Daily Fibonacci 61.8% | 1.2050 |
| Daily Pivot Point S1 | 1.1993 |
| Daily Pivot Point S2 | 1.1964 |
| Daily Pivot Point S3 | 1.1922 |
| Daily Pivot Point R1 | 1.2065 |
| Daily Pivot Point R2 | 1.2107 |
| Daily Pivot Point R3 | 1.2137 |
[/s2If]
Join Our Telegram Group
")


