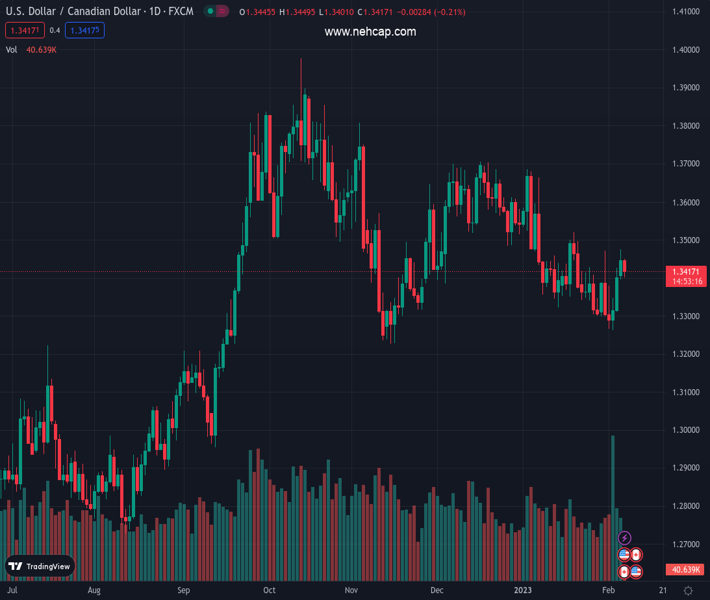
#USDCAD @ 1.34217 has picked strength after dropping to near 1.3400 as the risk-off impulse has rebounded. (Pivot Orderbook analysis)
…
This is a premium post.
[s2If !current_user_can(access_s2member_level4)]Please register for PREMIUM VERSION HERE to read full post below containing analysis. In case of any error or you think you are not able to read the full post below, please email us at support#nehcap.com [lwa][/s2If] [s2If current_user_can(access_s2member_level4)]
- USD/CAD has picked strength after dropping to near 1.3400 as the risk-off impulse has rebounded.
- Federal Reserve’s Powell might sound hawkish in his commentary amid a fresh rise in the US NFP data.
- Bank of Canada’s Macklem to dictate rationale behind pausing policy tightening spell.
- USD/CAD has faced barricades while attempting to deliver a Filling Channel breakout.
The pair currently trades last at 1.34217.
The previous day high was 1.3476 while the previous day low was 1.3397. The daily 38.2% Fib levels comes at 1.3446, expected to provide resistance. Similarly, the daily 61.8% fib level is at 1.3427, expected to provide resistance.
USD/CAD has sensed buying interest after a drop to near the round-level support at 1.3400 in the early European session. The Loonie asset has recovered to near 1.3430 and is demonstrating volatility as investors are getting anxious ahead of the speech from Federal Reserve (Fed) chair Jerome Powell and Bank of Canada (BoC) Governor Tiff Macklem, scheduled for Tuesday.
The US Dollar Index (DXY) has gauged cushion around 103.10 after a corrective move, which has also supported USD/CAD. S&P500 futures have surrendered some gains recorded in the Asian session, portraying that the recovery movement in the risk-on impulse is fading away. A decline in investors’ risk appetite could be the outcome of anxiety among investors ahead of the central banks’ speech, which will provide fresh impetus.
The return generated by the 10-year US Treasury yields has dropped to near 3.62%, however, the upside bias is still intact.
Investors are keenly awaiting the speech from Federal Reserve chair Jerome Powell for the interest rate guidance. December’s United States economic calendar showed a decline in consumer spending, a steep correction in the Producer Price Index (PPI) figures, and a slowdown in economic activities, which triggered the odds that the Federal Reserve might consider a pause in the interest rates and will observe the impact of higher interest rates for a period of time.
However, skyrocketing employment numbers and job openings despite weakening activities are indicating that firms are optimistic toward forward demand, which can trigger a rebound in the declining spell of the United States Consumer Price Index (CPI). Therefore, hawkish guidance on interest rates cannot be ruled out.
After pushing interest rates vigorously to 4.5%, the highest level in the past 15 years, Bank of Canada Governor Tiff Macklem explicitly paused the policy tightening. The central bank believes that they have much done to the interest rate and the disinflationary process has already started. Therefore, a pause in policy tightening spell looks satisfactory at this current juncture. Therefore, BoC Governor Tiff Macklem might sound less hawkish on interest rate guidance.
It seems that investors are also showing confidence that the current monetary policy by the Bank of Canada is restrictive enough to contain inflation. The Market Participants Survey for the fourth quarter of 2022 published by the Bank of Canada showed on Monday that the median of responses for the policy rate by the end-2023 stood at 4%, forecasting a 50 bps cut.
Also, the median forecast for the real Gross Domestic Product (GDP) points to a fall of 0.4% in 2023 and an expansion of 2% in 2024.
Oil price has extended its recovery above the critical resistance of $75.00 on expectations that the economic recovery in China will be quicker than expected. The commentary from International Energy Agency (IEA) Executive Director Fatih Birol on the sidelines of the India Energy Week conference on Sunday that “Oil producers may have to reconsider their output policies following a demand recovery in China, the world’s second-largest oil consumer,” as reported by Reuters has infused an adrenaline rush into the oil bulls. He further claimed, “Half of the growth in global oil demand this year will come from China.”
It is worth noting that Canada is a leading exporter of oil to the United States and higher oil price will strengthen the Canadian Dollar ahead.
USD/CAD is facing barricades while attempting to break the Falling Channel chart pattern on the upside on an hourly scale. The Loonie asset has dropped marginally, however, the upside bias cannot be ruled out.
The 50-period Exponential Moving Average (EMA) at 1.3407 is acting as major support for the US Dollar bulls.
Meanwhile, the Relative Strength Index (RSI) (14) has shifted into the 40.00-60.00 range from the bullish range of 60.00-80.000, which indicates a loss in the upside momentum.
Technical Levels: Supports and Resistances
USDCAD currently trading at 1.3417 at the time of writing. Pair opened at 1.3443 and is trading with a change of -0.19 % .
| Overview | Overview.1 | |
|---|---|---|
| 0 | Today last price | 1.3417 |
| 1 | Today Daily Change | -0.0026 |
| 2 | Today Daily Change % | -0.1900 |
| 3 | Today daily open | 1.3443 |
The pair is trading above its 20 Daily moving average @ 1.3383, below its 50 Daily moving average @ 1.3498 , below its 100 Daily moving average @ 1.3536 and above its 200 Daily moving average @ 1.3225
| Trends | Trends.1 | |
|---|---|---|
| 0 | Daily SMA20 | 1.3383 |
| 1 | Daily SMA50 | 1.3498 |
| 2 | Daily SMA100 | 1.3536 |
| 3 | Daily SMA200 | 1.3225 |
The previous day high was 1.3476 while the previous day low was 1.3397. The daily 38.2% Fib levels comes at 1.3446, expected to provide resistance. Similarly, the daily 61.8% fib level is at 1.3427, expected to provide resistance.
Note the levels of interest below:
- Pivot support is noted at 1.3401, 1.3359, 1.3322
- Pivot resistance is noted at 1.348, 1.3517, 1.3559
| Levels | Levels.1 |
|---|---|
| Previous Daily High | 1.3476 |
| Previous Daily Low | 1.3397 |
| Previous Weekly High | 1.3472 |
| Previous Weekly Low | 1.3262 |
| Previous Monthly High | 1.3685 |
| Previous Monthly Low | 1.3300 |
| Daily Fibonacci 38.2% | 1.3446 |
| Daily Fibonacci 61.8% | 1.3427 |
| Daily Pivot Point S1 | 1.3401 |
| Daily Pivot Point S2 | 1.3359 |
| Daily Pivot Point S3 | 1.3322 |
| Daily Pivot Point R1 | 1.3480 |
| Daily Pivot Point R2 | 1.3517 |
| Daily Pivot Point R3 | 1.3559 |
[/s2If]
Join Our Telegram Group
")


