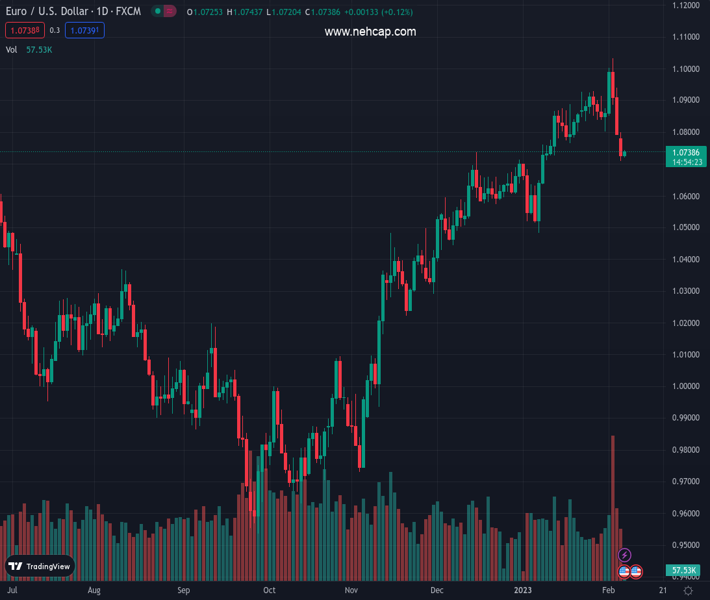
#EURUSD @ 1.07350 seesaws around intraday high as it snaps three-day downtrend., @nehcap view: Limited recovery expected (Pivot Orderbook analysis)
…
This is a premium post.
[s2If !current_user_can(access_s2member_level4)]Please register for PREMIUM VERSION HERE to read full post below containing analysis. In case of any error or you think you are not able to read the full post below, please email us at support#nehcap.com [lwa][/s2If] [s2If current_user_can(access_s2member_level4)]
- EUR/USD seesaws around intraday high as it snaps three-day downtrend.
- Oversold RSI underpins corrective bounce off short-term key support.
- Bearish MACD signals join 200-SMA to challenge Euro bulls.
- Downside bias remains intact below 1.0830, ascending trend line from late November acts as additional support.
The pair currently trades last at 1.07350.
The previous day high was 1.0799 while the previous day low was 1.071. The daily 38.2% Fib levels comes at 1.0744, expected to provide resistance. Similarly, the daily 61.8% fib level is at 1.0765, expected to provide resistance.
EUR/USD grinds near an intraday high of 1.0743 as it bounces off a five-week-old horizontal support during the early Tuesday in Europe. The major currency pair’s latest gains could also be linked to the oversold RSI (14).
However, the bearish MACD signals and the 200-SMA, close to 1.0765 by the press time, challenge the quote’s immediate upside.
Even if the quote stays firmer past 1.0765 SMA hurdle, a downward-sloping resistance line from the last Thursday, around 1.0830 at the latest, could act as the last defense of the EUR/USD bears.
Following that, the 1.0900 and the 1.1000 psychological magnet may act as buffers before directing the pair towards the latest swing high surrounding 1.1035.
Meanwhile, multiple levels marked since late December 2022, around 1.0710, challenge the EUR/USD bears. Also acting as short-term support is the 1.0700 round figure.
In a case where the EUR/USD pair remains bearish past 1.0700, an ascending support line from late November 2022, near 1.0650 as we write, will be important to watch.
It’s worth noting that the EUR/USD weakness below 1.0650 makes it vulnerable to refreshing the yearly low, currently around 1.0480.
Trend: Limited recovery expected
Technical Levels: Supports and Resistances
EURUSD currently trading at 1.0742 at the time of writing. Pair opened at 1.073 and is trading with a change of 0.11 % .
| Overview | Overview.1 | |
|---|---|---|
| 0 | Today last price | 1.0742 |
| 1 | Today Daily Change | 0.0012 |
| 2 | Today Daily Change % | 0.1100 |
| 3 | Today daily open | 1.0730 |
The pair is trading below its 20 Daily moving average @ 1.0841, above its 50 Daily moving average @ 1.0685 , above its 100 Daily moving average @ 1.0327 and above its 200 Daily moving average @ 1.032
| Trends | Trends.1 | |
|---|---|---|
| 0 | Daily SMA20 | 1.0841 |
| 1 | Daily SMA50 | 1.0685 |
| 2 | Daily SMA100 | 1.0327 |
| 3 | Daily SMA200 | 1.0320 |
The previous day high was 1.0799 while the previous day low was 1.071. The daily 38.2% Fib levels comes at 1.0744, expected to provide resistance. Similarly, the daily 61.8% fib level is at 1.0765, expected to provide resistance.
Note the levels of interest below:
- Pivot support is noted at 1.0693, 1.0657, 1.0604
- Pivot resistance is noted at 1.0782, 1.0835, 1.0872
| Levels | Levels.1 |
|---|---|
| Previous Daily High | 1.0799 |
| Previous Daily Low | 1.0710 |
| Previous Weekly High | 1.1033 |
| Previous Weekly Low | 1.0793 |
| Previous Monthly High | 1.0930 |
| Previous Monthly Low | 1.0483 |
| Daily Fibonacci 38.2% | 1.0744 |
| Daily Fibonacci 61.8% | 1.0765 |
| Daily Pivot Point S1 | 1.0693 |
| Daily Pivot Point S2 | 1.0657 |
| Daily Pivot Point S3 | 1.0604 |
| Daily Pivot Point R1 | 1.0782 |
| Daily Pivot Point R2 | 1.0835 |
| Daily Pivot Point R3 | 1.0872 |
[/s2If]
Join Our Telegram Group
")


