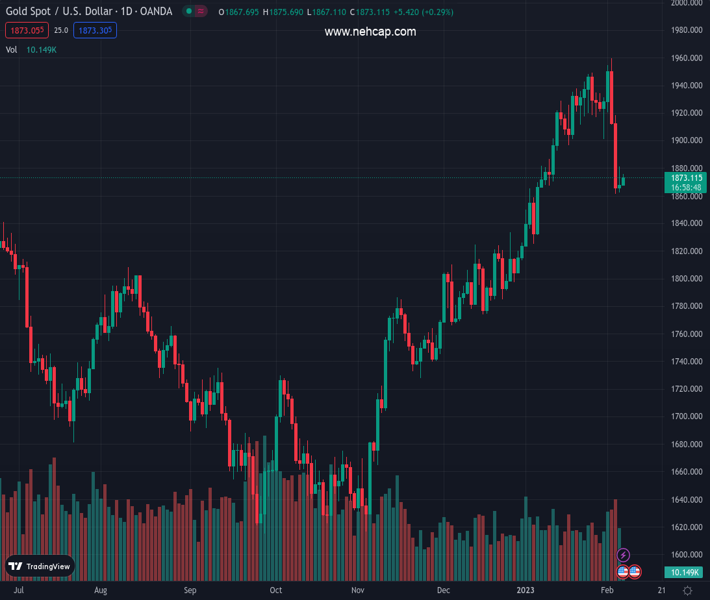
#XAUUSD @ 1,873.13 Gold price has sensed selling pressure after encountering significant offers near $1,875.00. (Pivot Orderbook analysis)
…
This is a premium post.
[s2If !current_user_can(access_s2member_level4)]Please register for PREMIUM VERSION HERE to read full post below containing analysis. In case of any error or you think you are not able to read the full post below, please email us at support#nehcap.com [lwa][/s2If] [s2If current_user_can(access_s2member_level4)]
- Gold price has sensed selling pressure after encountering significant offers near $1,875.00.
- A topsy-turvy performance is expected from the USD Index ahead of Fed Powell’s speech.
- The battle between the Fed and higher inflation could get uglier amid a fresh rise in US employment data.
The pair currently trades last at 1873.13.
The previous day high was 1881.39 while the previous day low was 1860.3. The daily 38.2% Fib levels comes at 1873.33, expected to provide resistance. Similarly, the daily 61.8% fib level is at 1868.36, expected to provide support.
Gold price (XAU/USD) is facing pressures in recovery extension above the critical resistance of $1,875.00 in the Asian session. The precious metal has sensed selling interest as the US Dollar Index (DXY) has attempted a recovery after correcting to near 103.10. A topsy-turvy performance is expected from the USD Index as investors are awaiting the speech from Federal Reserve (Fed) chair Jerome Powell for fresh impetus.
The USD Index (DXY) was highly expected to demonstrate some volatility contraction signs after a three-day winning streak post mammoth United States Nonfarm Payrolls (NFP) data. The USD Index bulls have exhausted after a sheer ride, and the upside bias is still intact. S&P500 futures are holding minor gains recorded in the Asian session.
The speech from Fed chair Jerome Powell ahead has become significant amid a fresh rise in the employment numbers in the United States labor market. After observing a meaningful decline trend in inflation, the street started expecting a pause in the policy tightening spell by the Fed. However, the upbeat January employment data has conveyed that the battle against inflation has a lot of steam left.
Technical Levels: Supports and Resistances
XAUUSD currently trading at 1872.3 at the time of writing. Pair opened at 1868.5 and is trading with a change of 0.2 % .
| Overview | Overview.1 | |
|---|---|---|
| 0 | Today last price | 1872.3 |
| 1 | Today Daily Change | 3.8 |
| 2 | Today Daily Change % | 0.2 |
| 3 | Today daily open | 1868.5 |
The pair is trading below its 20 Daily moving average @ 1914.22, above its 50 Daily moving average @ 1848.61 , above its 100 Daily moving average @ 1768.4 and above its 200 Daily moving average @ 1776.01
| Trends | Trends.1 | |
|---|---|---|
| 0 | Daily SMA20 | 1914.22 |
| 1 | Daily SMA50 | 1848.61 |
| 2 | Daily SMA100 | 1768.40 |
| 3 | Daily SMA200 | 1776.01 |
The previous day high was 1881.39 while the previous day low was 1860.3. The daily 38.2% Fib levels comes at 1873.33, expected to provide resistance. Similarly, the daily 61.8% fib level is at 1868.36, expected to provide support.
Note the levels of interest below:
- Pivot support is noted at 1858.74, 1848.97, 1837.65
- Pivot resistance is noted at 1879.83, 1891.15, 1900.92
| Levels | Levels.1 |
|---|---|
| Previous Daily High | 1881.39 |
| Previous Daily Low | 1860.30 |
| Previous Weekly High | 1959.80 |
| Previous Weekly Low | 1861.45 |
| Previous Monthly High | 1949.27 |
| Previous Monthly Low | 1823.76 |
| Daily Fibonacci 38.2% | 1873.33 |
| Daily Fibonacci 61.8% | 1868.36 |
| Daily Pivot Point S1 | 1858.74 |
| Daily Pivot Point S2 | 1848.97 |
| Daily Pivot Point S3 | 1837.65 |
| Daily Pivot Point R1 | 1879.83 |
| Daily Pivot Point R2 | 1891.15 |
| Daily Pivot Point R3 | 1900.92 |
[/s2If]
Join Our Telegram Group
")


