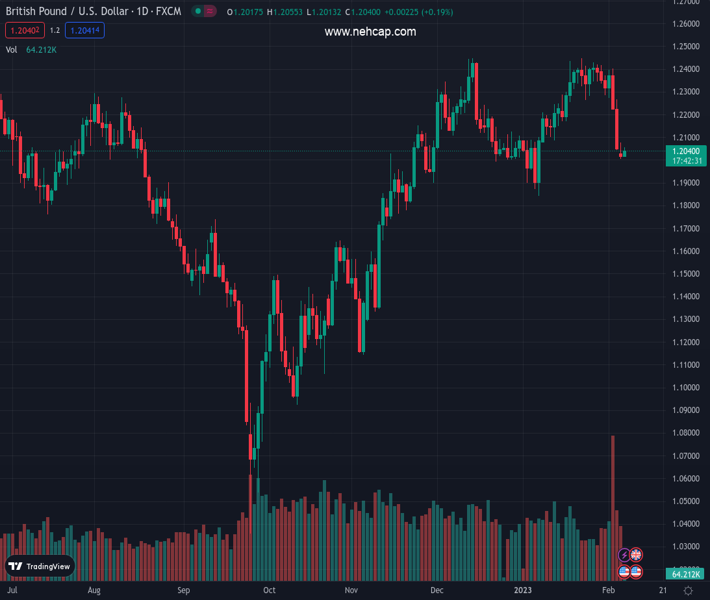
#GBPUSD @ 1.20402 picks up bids to refresh intraday high, snaps three-day downtrend to recover from one-month low., @nehcap view: Further downside expected (Pivot Orderbook analysis)
…
This is a premium post.
[s2If !current_user_can(access_s2member_level4)]Please register for PREMIUM VERSION HERE to read full post below containing analysis. In case of any error or you think you are not able to read the full post below, please email us at support#nehcap.com [lwa][/s2If] [s2If current_user_can(access_s2member_level4)]
- GBP/USD picks up bids to refresh intraday high, snaps three-day downtrend to recover from one-month low.
- Nearly oversold RSI triggers corrective bounce but bears stay hopeful.
- Clear downside break of previous key support lines, bearish MACD signals favor sellers.
- Cable buyers remain confused unless crossing 1.2450 hurdle.
The pair currently trades last at 1.20402.
The previous day high was 1.2078 while the previous day low was 1.2006. The daily 38.2% Fib levels comes at 1.2033, expected to provide support. Similarly, the daily 61.8% fib level is at 1.205, expected to provide resistance.
GBP/USD consolidates recent losses while picking up bids to 1.2050 during early Tuesday morning in Europe, printing the first daily gains in four. In doing so, the Cable pair justifies the nearly oversold RSI (14) as traders await fresh clues.
Even so, the quote holds on to the previous week’s downside break of the key support lines from October and September 2022, now resistance around 1.2150 and 1.2275 in that order.
Also keeping the Cable bears hopeful is the clear U-turn from the two-month-old horizontal resistance area surrounding 1.2450.
As a result, the GBP/USD rebound remains elusive unless it crosses the 1.2450 resistance while the 1.2150 appears the nearby hurdle for the intraday buyers to cross.
In a case where the Cable pair stays firmer past 1.2450, the May 2022 high near 1.2665 could lure the bulls.
On the flip side, the 1.2000 psychological magnet puts a floor under the GBP/USD prices ahead of the 200-DMA support of 1.1950.
Following that, the previous monthly low near 1.1840 and the September high around 1.1735 could challenge the pair sellers before giving them control.
Trend: Further downside expected
Technical Levels: Supports and Resistances
GBPUSD currently trading at 1.2047 at the time of writing. Pair opened at 1.2023 and is trading with a change of 0.20% % .
| Overview | Overview.1 | |
|---|---|---|
| 0 | Today last price | 1.2047 |
| 1 | Today Daily Change | 0.0024 |
| 2 | Today Daily Change % | 0.20% |
| 3 | Today daily open | 1.2023 |
The pair is trading below its 20 Daily moving average @ 1.2281, below its 50 Daily moving average @ 1.2191 , above its 100 Daily moving average @ 1.181 and above its 200 Daily moving average @ 1.1953
| Trends | Trends.1 | |
|---|---|---|
| 0 | Daily SMA20 | 1.2281 |
| 1 | Daily SMA50 | 1.2191 |
| 2 | Daily SMA100 | 1.1810 |
| 3 | Daily SMA200 | 1.1953 |
The previous day high was 1.2078 while the previous day low was 1.2006. The daily 38.2% Fib levels comes at 1.2033, expected to provide support. Similarly, the daily 61.8% fib level is at 1.205, expected to provide resistance.
Note the levels of interest below:
- Pivot support is noted at 1.1993, 1.1964, 1.1922
- Pivot resistance is noted at 1.2065, 1.2107, 1.2137
| Levels | Levels.1 |
|---|---|
| Previous Daily High | 1.2078 |
| Previous Daily Low | 1.2006 |
| Previous Weekly High | 1.2418 |
| Previous Weekly Low | 1.2050 |
| Previous Monthly High | 1.2448 |
| Previous Monthly Low | 1.1841 |
| Daily Fibonacci 38.2% | 1.2033 |
| Daily Fibonacci 61.8% | 1.2050 |
| Daily Pivot Point S1 | 1.1993 |
| Daily Pivot Point S2 | 1.1964 |
| Daily Pivot Point S3 | 1.1922 |
| Daily Pivot Point R1 | 1.2065 |
| Daily Pivot Point R2 | 1.2107 |
| Daily Pivot Point R3 | 1.2137 |
[/s2If]
Join Our Telegram Group
")


