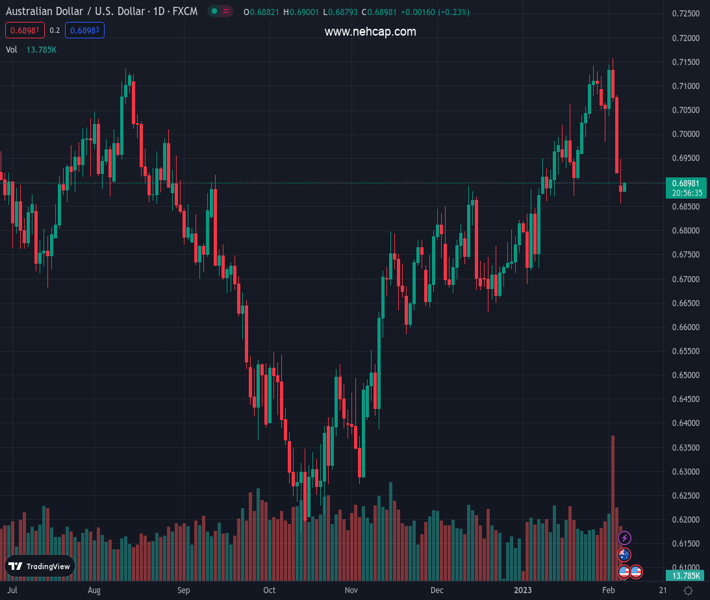
#AUDUSD @ 0.68970 struggles to gain clear directions from Aussie trade numbers for December. (Pivot Orderbook analysis)
…
This is a premium post.
[s2If !current_user_can(access_s2member_level4)]Please register for PREMIUM VERSION HERE to read full post below containing analysis. In case of any error or you think you are not able to read the full post below, please email us at support#nehcap.com [lwa][/s2If] [s2If current_user_can(access_s2member_level4)]
- AUD/USD struggles to gain clear directions from Aussie trade numbers for December.
- Australia trade surplus, exports dropped in December, imports improved.
- Market sentiment remains dicey ahead of top-tier events.
- AUD/USD upside hinges on RBA’s more than 0.25% rate hike, Fed’s Powell may praise latest data to defend US Dollar.
The pair currently trades last at 0.68970.
The previous day high was 0.6948 while the previous day low was 0.6856. The daily 38.2% Fib levels comes at 0.6891, expected to provide support. Similarly, the daily 61.8% fib level is at 0.6913, expected to provide resistance.
AUD/USD remains sidelined around the intraday high near 0.6890, portraying the typical pre-data anxiety, as the Aussie pair traders await the Reserve Bank of Australia’s (RBA) monetary policy meeting announcements on early Tuesday. In doing so, the risk barometer pair also takes clues from the sluggish market sentiment, as well as mixed data at home.
Australia’s headline Trade Balance eased in December to 12,237M from 13,245M expected and 13,201M prior. Also negative was the Exports growth which sank to -1.0% from 0.0%. However, the improvement in Imports, from -1.0% to 1.0%, seemed to have defended the AUD/USD bulls.
It should be noted that the recent improvement in the Aussie-China ties seemed to have triggered trade optimism for the AUD/USD pair traders. Following a virtual meeting between trade ministers of Australia and China on February 6, China’s Commerce Ministry said that Australian and Chinese trade and commerce ministers conducted pragmatic and candid exchanges.
Elsewhere, comments rejecting fears of the US recession from Treasury Secretary Janet Yellen and President Joe Biden allow S&P 500 Futures to print mild gains. However, hawkish concerns surrounding the Fed, backed by the US data and Fed talks, seem to challenge the risk appetite, as well as the AUD/USD bulls.
“The strong labor market probably means ‘we have to do a little more work,’” said Federal Reserve Bank of Atlanta President Raphel Bostic in an interview with Bloomberg.
Amid these plays, the US 10-year Treasury bond yields grind higher around 3.63%, after a two-day rebound from the monthly low.
Looking ahead, AUD/USD pair traders should pay attention to how the RBA justifies the latest jump in inflation and economic challenges. That said, the Aussie central bank is up for 0.25% rate hike but can surprise the bulls with a 0.50% rate lift.
Following the RBA action, Fed Chair Jerome Powell’s speech, as well as US President Joe Biden’s State of the Union (SOTU) comments, will also be important for the AUD/USD pair traders to watch. Should Powell chooses to praise the latest economic developments in the US, as well as reiterate hawkish bias for the monetary policy, the AUD/USD could have a further downside to track.
Also read: Reserve Bank of Australia Preview: No choice but to keep hiking rates
A convergence of the the 50-DMA and 61.8% Fibonacci retracement level of the June-October 2022 downturn, around 0.6860 by the press time, defends the AUD/USD bulls. However, bearish MACD signals and a sustained closing below the three-month-old previous support line, close to 0.6930 by the press time, keep the Aussie bears hopeful.
Technical Levels: Supports and Resistances
AUDUSD currently trading at 0.6891 at the time of writing. Pair opened at 0.6885 and is trading with a change of 0.09% % .
| Overview | Overview.1 | |
|---|---|---|
| 0 | Today last price | 0.6891 |
| 1 | Today Daily Change | 0.0006 |
| 2 | Today Daily Change % | 0.09% |
| 3 | Today daily open | 0.6885 |
The pair is trading below its 20 Daily moving average @ 0.7002, above its 50 Daily moving average @ 0.6856 , above its 100 Daily moving average @ 0.6672 and above its 200 Daily moving average @ 0.681
| Trends | Trends.1 | |
|---|---|---|
| 0 | Daily SMA20 | 0.7002 |
| 1 | Daily SMA50 | 0.6856 |
| 2 | Daily SMA100 | 0.6672 |
| 3 | Daily SMA200 | 0.6810 |
The previous day high was 0.6948 while the previous day low was 0.6856. The daily 38.2% Fib levels comes at 0.6891, expected to provide support. Similarly, the daily 61.8% fib level is at 0.6913, expected to provide resistance.
Note the levels of interest below:
- Pivot support is noted at 0.6844, 0.6803, 0.6751
- Pivot resistance is noted at 0.6937, 0.6989, 0.703
| Levels | Levels.1 |
|---|---|
| Previous Daily High | 0.6948 |
| Previous Daily Low | 0.6856 |
| Previous Weekly High | 0.7158 |
| Previous Weekly Low | 0.6919 |
| Previous Monthly High | 0.7143 |
| Previous Monthly Low | 0.6688 |
| Daily Fibonacci 38.2% | 0.6891 |
| Daily Fibonacci 61.8% | 0.6913 |
| Daily Pivot Point S1 | 0.6844 |
| Daily Pivot Point S2 | 0.6803 |
| Daily Pivot Point S3 | 0.6751 |
| Daily Pivot Point R1 | 0.6937 |
| Daily Pivot Point R2 | 0.6989 |
| Daily Pivot Point R3 | 0.7030 |
[/s2If]
Join Our Telegram Group
")


