US Dollar Index grinds near one-month high as bulls take a breather after three-day uptrend. (Pivot Orderbook analysis)
…
This is a premium post.
[s2If !current_user_can(access_s2member_level4)]Please register for PREMIUM VERSION HERE to read full post below containing analysis. In case of any error or you think you are not able to read the full post below, please email us at support#nehcap.com [lwa][/s2If] [s2If current_user_can(access_s2member_level4)]
- US Dollar Index grinds near one-month high as bulls take a breather after three-day uptrend.
- US President Biden, Treasury Secretary Yellen pushed back recession woes and favored hawkish bias over Fed, underpinning DXY run-up.
- Absence of escalation in US-China tussles, cautious mood ahead of Fed Chair Powell’s speech probe greenback buyers.
- Powell needs to praise recently firmer US data to keep US Dollar Index bulls on the table.
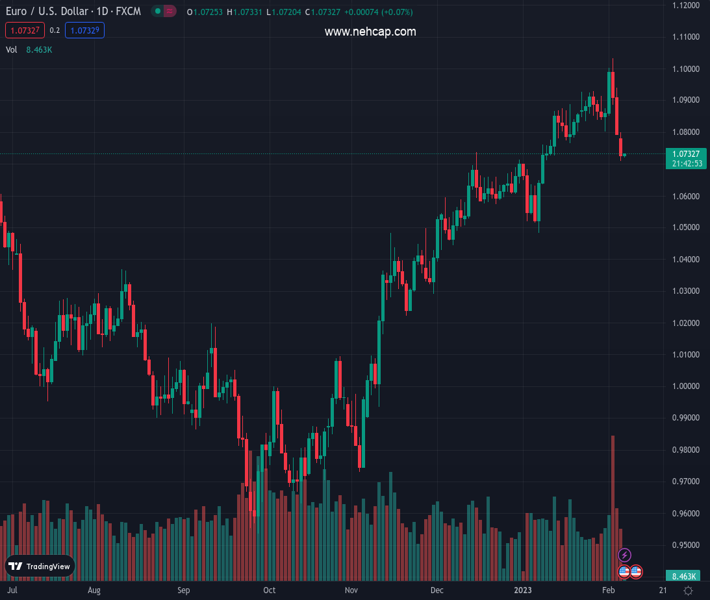
The pair currently trades last at 103.6.
The previous day high was 103.77 while the previous day low was 103.01. The daily 38.2% Fib levels comes at 102.45, expected to provide support. Similarly, the daily 61.8% fib level is at 102.1, expected to provide support.
US Dollar Index (DXY) makes rounds to 103.60 as buyers flex muscles ahead of the key speech from Federal Reserve (Fed) Chairman Jerome Powell. In doing so, the greenback’s gauge versus the six major currencies tracks upbeat US Treasury bond yields, as well as hawkish concerns surrounding the Fed, to keep the DXY bulls hopeful.
That said, statements from US Treasury Secretary Janet Yellen and President Biden favor DXY bulls, by pushing back the recession woes and bolstering the hawkish bets on the Fed’s next moves. That said, both policymakers turned down expectations of the US recession in their respective speeches. The greenback also cheered sustained run-up in the US Treasury bond yields and downbeat equities as traders renew hawkish bets on the Fed after strong US data.
It’s worth noting that the last week’s upbeat prints of the US employment, wages and activity numbers renewed hopes that the Fed has a way to go before welcoming the rate cute chatters, as well as the policy doves.
Other than the receding recession fears and upbeat US data-led hawkish Fed bias, the recent talks surrounding the Sino-American ties also entertain the DXY bulls the previous day, especially after the US shot down a Chinese balloon and pushed back a diplomatic visit to Beijing. However, the latest comments from US President Joe Bide appear soothing on the matter as he said, “The balloon incident does not weaken US-China relations.”
Against this backdrop, Wall Street closed in the red and the US 10-year Treasury bond yields extended the last Friday’s rebound, which in turn allowed the DXY to remain firmer for the third consecutive day.
Looking forward, US Dollar Index may witness a sideways move ahead of the key Fed Chair Jerome Powell’s speech, as well as US President Joe Biden’s State of the Union (SOTU) comments. Should Powell chooses to praise the latest economic developments in the US, as well as reiterate hawkish bias for the monetary policy, the DXY could have further upside to track.
Although confirmation of a three-month-old falling bullish chart formation keeps the US Dollar Index (DXY) bulls hopeful, the 50-DMA resistance surrounding 103.60 challenges the immediate upside momentum.
Technical Levels: Supports and Resistances
EURUSD currently trading at 103.6 at the time of writing. Pair opened at 103.64 and is trading with a change of -0.04% % .
| Overview | Overview.1 | |
|---|---|---|
| 0 | Today last price | 103.6 |
| 1 | Today Daily Change | -0.04 |
| 2 | Today Daily Change % | -0.04% |
| 3 | Today daily open | 103.64 |
The pair is trading above its 20 Daily moving average @ 102.25, below its 50 Daily moving average @ 103.6 , below its 100 Daily moving average @ 106.53 and below its 200 Daily moving average @ 106.69
| Trends | Trends.1 | |
|---|---|---|
| 0 | Daily SMA20 | 102.25 |
| 1 | Daily SMA50 | 103.60 |
| 2 | Daily SMA100 | 106.53 |
| 3 | Daily SMA200 | 106.69 |
The previous day high was 103.77 while the previous day low was 103.01. The daily 38.2% Fib levels comes at 102.45, expected to provide support. Similarly, the daily 61.8% fib level is at 102.1, expected to provide support.
Note the levels of interest below:
- Pivot support is noted at 102.03, 101.06, 100.57
- Pivot resistance is noted at 103.49, 103.98, 104.96
| Levels | Levels.1 |
|---|---|
| Previous Daily High | 103.77 |
| Previous Daily Low | 103.01 |
| Previous Weekly High | 103.01 |
| Previous Weekly Low | 100.81 |
| Previous Monthly High | 105.63 |
| Previous Monthly Low | 101.50 |
| Daily Fibonacci 38.2% | 102.45 |
| Daily Fibonacci 61.8% | 102.10 |
| Daily Pivot Point S1 | 102.03 |
| Daily Pivot Point S2 | 101.06 |
| Daily Pivot Point S3 | 100.57 |
| Daily Pivot Point R1 | 103.49 |
| Daily Pivot Point R2 | 103.98 |
| Daily Pivot Point R3 | 104.96 |
[/s2If]
Join Our Telegram Group
")


