#NZDUSD @ 0.63084 licks its wounds near one-month low, probes three-day downtrend., @nehcap view: Further downside expected (Pivot Orderbook analysis)
…
This is a premium post.
[s2If !current_user_can(access_s2member_level4)]Please register for PREMIUM VERSION HERE to read full post below containing analysis. In case of any error or you think you are not able to read the full post below, please email us at support#nehcap.com [lwa][/s2If] [s2If current_user_can(access_s2member_level4)]
- NZD/USD licks its wounds near one-month low, probes three-day downtrend.
- Convergence of 200-day EMA, lower line of rising wedge challenges bears.
- 50-day EMA guards immediate recovery but downbeat oscillators pushback bullish bias.
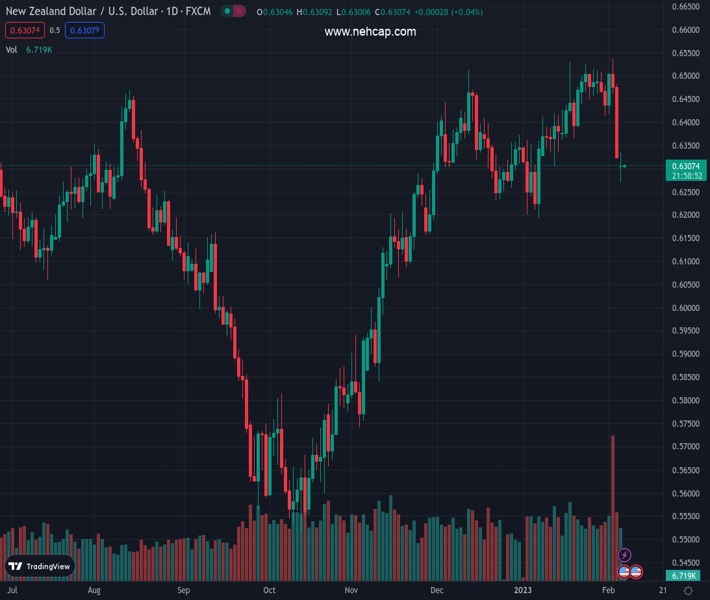
The pair currently trades last at 0.63084.
The previous day high was 0.6485 while the previous day low was 0.6322. The daily 38.2% Fib levels comes at 0.6384, expected to provide resistance. Similarly, the daily 61.8% fib level is at 0.6423, expected to provide resistance.
NZD/USD seesaws around the 0.6300 round figure as bears take a breather, after a three-day south-run, during early Tuesday. In doing so, the Kiwi pair portrays a corrective bounce off the 0.6270 support confluence amid downbeat oscillators.
Even so, the Kiwi pair’s sustained trading below the 50-day Exponential Moving Average (EMA) keeps the sellers hopeful unless the quote surpasses the 0.6340 immediate hurdle.
During the quote’s upside past 0.6340, the 0.6400 and 0.6500 round figures may offer an intermediate halt before challenging the bearish formation, namely the rising wedge, by attacking the top line of the pattern, currently around 0.6545.
It’s worth noting that the NZD/USD pair’s run-up beyond 0.6545 could propel prices toward June 2022 high near 0.6575 ahead of highlighting the 0.6600 threshold for the bulls.
Alternatively, a daily closing below the 0.6270 key support, encompassing the 200-day EMA and bottom line of the stated wedge, will confirm the bearish chart pattern, putting the base for a theoretical slump towards the sub-0.6000 levels.
During the anticipated fall, the mid-November 2022’s low near 0.6065 and the 0.6000 psychological magnet could act as the key intermediate halts.
Overall, NZD/USD remains on the bear’s radar despite the latest rebound.
Trend: Further downside expected
Technical Levels: Supports and Resistances
NZDUSD currently trading at 0.6305 at the time of writing. Pair opened at 0.6324 and is trading with a change of -0.30% % .
| Overview | Overview.1 | |
|---|---|---|
| 0 | Today last price | 0.6305 |
| 1 | Today Daily Change | -0.0019 |
| 2 | Today Daily Change % | -0.30% |
| 3 | Today daily open | 0.6324 |
The pair is trading below its 20 Daily moving average @ 0.6434, below its 50 Daily moving average @ 0.637 , above its 100 Daily moving average @ 0.6107 and above its 200 Daily moving average @ 0.6191
| Trends | Trends.1 | |
|---|---|---|
| 0 | Daily SMA20 | 0.6434 |
| 1 | Daily SMA50 | 0.6370 |
| 2 | Daily SMA100 | 0.6107 |
| 3 | Daily SMA200 | 0.6191 |
The previous day high was 0.6485 while the previous day low was 0.6322. The daily 38.2% Fib levels comes at 0.6384, expected to provide resistance. Similarly, the daily 61.8% fib level is at 0.6423, expected to provide resistance.
Note the levels of interest below:
- Pivot support is noted at 0.6269, 0.6214, 0.6106
- Pivot resistance is noted at 0.6432, 0.654, 0.6595
| Levels | Levels.1 |
|---|---|
| Previous Daily High | 0.6485 |
| Previous Daily Low | 0.6322 |
| Previous Weekly High | 0.6538 |
| Previous Weekly Low | 0.6322 |
| Previous Monthly High | 0.6531 |
| Previous Monthly Low | 0.6190 |
| Daily Fibonacci 38.2% | 0.6384 |
| Daily Fibonacci 61.8% | 0.6423 |
| Daily Pivot Point S1 | 0.6269 |
| Daily Pivot Point S2 | 0.6214 |
| Daily Pivot Point S3 | 0.6106 |
| Daily Pivot Point R1 | 0.6432 |
| Daily Pivot Point R2 | 0.6540 |
| Daily Pivot Point R3 | 0.6595 |
[/s2If]
Join Our Telegram Group
")


