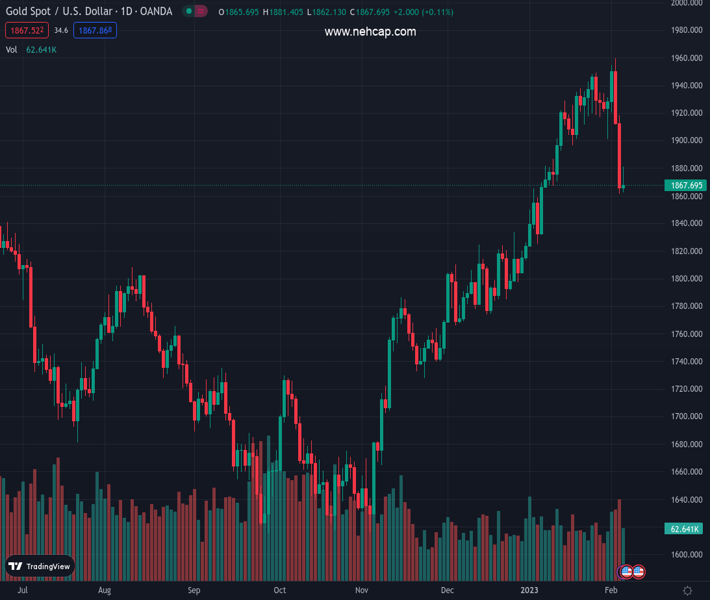
#XAUUSD @ 1,867.53 Gold price has faced barricades around the 23.6% Fibo retracement at $1,880.00 as yields soar. (Pivot Orderbook analysis)
…
This is a premium post.
[s2If !current_user_can(access_s2member_level4)]Please register for PREMIUM VERSION HERE to read full post below containing analysis. In case of any error or you think you are not able to read the full post below, please email us at support#nehcap.com [lwa][/s2If] [s2If current_user_can(access_s2member_level4)]
- Gold price has faced barricades around the 23.6% Fibo retracement at $1,880.00 as yields soar.
- The commentary from Fed Powell about interest rate guidance will be keenly watched.
- The USD Index has refreshed its four-week high at 103.28 amid a risk-off mood.
The pair currently trades last at 1867.53.
The previous day high was 1918.65 while the previous day low was 1861.45. The daily 38.2% Fib levels comes at 1883.3, expected to provide resistance. Similarly, the daily 61.8% fib level is at 1896.8, expected to provide resistance.
Gold price (XAU/USD) is displaying a sideways auction after building a cushion around $1,860.00 in the early Asian session. The precious metal is expected to display more weakness after surrendering immediate support as US Treasury yields are gaining dramatically ahead of the speech by Federal Reserve (Fed) chair Jerome Powell. The return generated by 10-year US Treasury bonds has scaled to nearly 3.65% with sheer pace.
Markets remained jittery on Monday led by US-China tensions and tight United States labor market data, which has infused fresh blood into Fed’s policy tightening spell. The risk aversion theme kept S&P500 in a negative trajectory consecutive for the second trading session. The US Dollar Index (DXY) extended its upside journey after surpassing the 102.80 resistance and refreshed its four-week high at 103.28.
For further guidance, the commentary from Fed’s Powell about the roadmap of taming stubborn inflation and fresh concerns about inflation projections due to a rebound in labor market conditions will be keenly watched. Meanwhile, U.S. Treasury Secretary Janet Yellen said on Monday the United States may avoid a recession as inflation is coming down while the labor market remains strong, as reported by Reuters.
Gold price has sensed rejection after attempting to scale above the 203.6% Fibonacci retracement (placed from November 3 low at $1,616.69 to February 2 high of around $1,960.00) at around $1,880.00 on a four-hour scale. A rejection around 23.6% Fibo retracement indicates that the asset has been exposed to the next cushion at 38.2% Fibo retracement placed around $1,829.45.
A bear cross, represented by the 20-and 50-period Exponential Moving Averages (EMAs) at $1,921.60, adds to the downside filters.
Adding to that, the Relative Strength Index (RSI) (14) has shifted into the bearish range of 20.00-40.00, which indicates more weakness ahead.
Technical Levels: Supports and Resistances
XAUUSD currently trading at 1867.46 at the time of writing. Pair opened at 1864.86 and is trading with a change of 0.14 % .
| Overview | Overview.1 | |
|---|---|---|
| 0 | Today last price | 1867.46 |
| 1 | Today Daily Change | 2.60 |
| 2 | Today Daily Change % | 0.14 |
| 3 | Today daily open | 1864.86 |
The pair is trading below its 20 Daily moving average @ 1914.36, above its 50 Daily moving average @ 1846.04 , above its 100 Daily moving average @ 1766.47 and above its 200 Daily moving average @ 1775.99
| Trends | Trends.1 | |
|---|---|---|
| 0 | Daily SMA20 | 1914.36 |
| 1 | Daily SMA50 | 1846.04 |
| 2 | Daily SMA100 | 1766.47 |
| 3 | Daily SMA200 | 1775.99 |
The previous day high was 1918.65 while the previous day low was 1861.45. The daily 38.2% Fib levels comes at 1883.3, expected to provide resistance. Similarly, the daily 61.8% fib level is at 1896.8, expected to provide resistance.
Note the levels of interest below:
- Pivot support is noted at 1844.66, 1824.45, 1787.46
- Pivot resistance is noted at 1901.86, 1938.85, 1959.06
| Levels | Levels.1 |
|---|---|
| Previous Daily High | 1918.65 |
| Previous Daily Low | 1861.45 |
| Previous Weekly High | 1959.80 |
| Previous Weekly Low | 1861.45 |
| Previous Monthly High | 1949.27 |
| Previous Monthly Low | 1823.76 |
| Daily Fibonacci 38.2% | 1883.30 |
| Daily Fibonacci 61.8% | 1896.80 |
| Daily Pivot Point S1 | 1844.66 |
| Daily Pivot Point S2 | 1824.45 |
| Daily Pivot Point S3 | 1787.46 |
| Daily Pivot Point R1 | 1901.86 |
| Daily Pivot Point R2 | 1938.85 |
| Daily Pivot Point R3 | 1959.06 |
[/s2If]
Join Our Telegram Group
")


