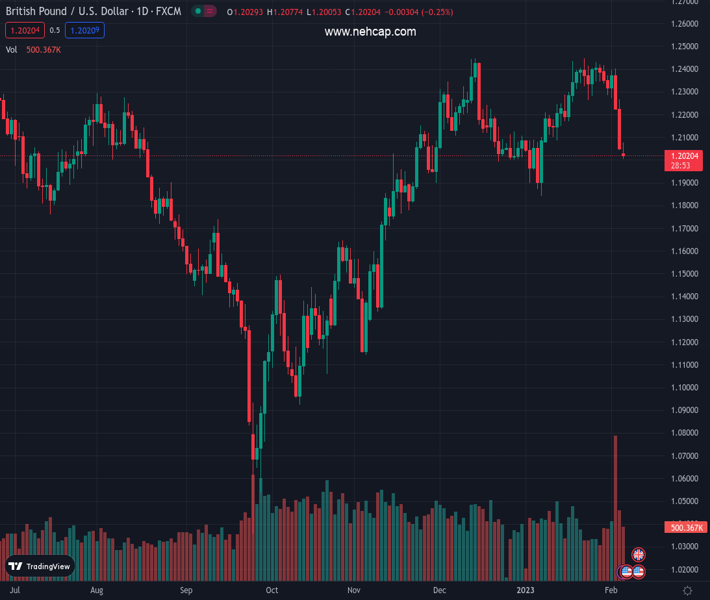
#GBPUSD @ 1.20206 Since last Thursday, the has lost more than 3% as the US Dollar strengthened. (Pivot Orderbook analysis)
…
This is a premium post.
[s2If !current_user_can(access_s2member_level4)]Please register for PREMIUM VERSION HERE to read full post below containing analysis. In case of any error or you think you are not able to read the full post below, please email us at support#nehcap.com [lwa][/s2If] [s2If current_user_can(access_s2member_level4)]
- Since last Thursday, the GBP/USD has lost more than 3% as the US Dollar strengthened.
- GBP/USD Price Analysis: Daily close below the 100-DMA would exacerbate a test of 1.2000.
The pair currently trades last at 1.20206.
The previous day high was 1.2266 while the previous day low was 1.205. The daily 38.2% Fib levels comes at 1.2132, expected to provide resistance. Similarly, the daily 61.8% fib level is at 1.2183, expected to provide resistance.
The Pound Sterling (GBP) capped its fall against the US Dollar (USD) on Monday at around the 100-day Exponential Moving Average (EMA) at 1.2028, though the GBP/USD remains below the latter. That said, a GBP/USD daily close would keep bears hopeful of testing the 1.2000 figure. At the time of writing, the GBP/USD hovers around 1.2024 after hitting a daily high of 1.2077.
Since last Thursday, after the Bank of England (BoE) raised rates by 50 bps, lifting the Bank Rate to 4%, the GBP/USD collapsed by 1.20%. Then it was followed by last Friday’s US jobs data, which exerted downward pressure, sending the GBP/USD into a tailspin, plummeting more than 150 pips in the session toward the 1.2050 area.
All that said, the technical outlook is tilted to the downside. Oscillators like the Relative Strength Index (RSI) and the Rate of Change (RoC0 turned bearish. The latter shows that sellers are gathering strong momentum, posing a threat to crack the psychological 1.2000.
If the GBP/USD breaks below 1.20, that would open the door for further downside. Once cleared, GBP/USD’s next support would be 1.1900, followed by a two-month-old upslope trendline that passes at around 1.1880-1.1900 and then the YTD Low at 1.1841.
Technical Levels: Supports and Resistances
GBPUSD currently trading at 1.2019 at the time of writing. Pair opened at 1.205 and is trading with a change of -0.26 % .
| Overview | Overview.1 | |
|---|---|---|
| 0 | Today last price | 1.2019 |
| 1 | Today Daily Change | -0.0031 |
| 2 | Today Daily Change % | -0.2600 |
| 3 | Today daily open | 1.2050 |
The pair is trading below its 20 Daily moving average @ 1.2289, below its 50 Daily moving average @ 1.219 , above its 100 Daily moving average @ 1.1804 and above its 200 Daily moving average @ 1.1955
| Trends | Trends.1 | |
|---|---|---|
| 0 | Daily SMA20 | 1.2289 |
| 1 | Daily SMA50 | 1.2190 |
| 2 | Daily SMA100 | 1.1804 |
| 3 | Daily SMA200 | 1.1955 |
The previous day high was 1.2266 while the previous day low was 1.205. The daily 38.2% Fib levels comes at 1.2132, expected to provide resistance. Similarly, the daily 61.8% fib level is at 1.2183, expected to provide resistance.
Note the levels of interest below:
- Pivot support is noted at 1.1979, 1.1907, 1.1763
- Pivot resistance is noted at 1.2194, 1.2337, 1.2409
| Levels | Levels.1 |
|---|---|
| Previous Daily High | 1.2266 |
| Previous Daily Low | 1.2050 |
| Previous Weekly High | 1.2418 |
| Previous Weekly Low | 1.2050 |
| Previous Monthly High | 1.2448 |
| Previous Monthly Low | 1.1841 |
| Daily Fibonacci 38.2% | 1.2132 |
| Daily Fibonacci 61.8% | 1.2183 |
| Daily Pivot Point S1 | 1.1979 |
| Daily Pivot Point S2 | 1.1907 |
| Daily Pivot Point S3 | 1.1763 |
| Daily Pivot Point R1 | 1.2194 |
| Daily Pivot Point R2 | 1.2337 |
| Daily Pivot Point R3 | 1.2409 |
[/s2If]
Join Our Telegram Group
")


