Western Texas Intermediate recovers some ground even though the US Dollar remains buoyant. (Pivot Orderbook analysis)
…
This is a premium post.
[s2If !current_user_can(access_s2member_level4)]Please register for PREMIUM VERSION HERE to read full post below containing analysis. In case of any error or you think you are not able to read the full post below, please email us at support#nehcap.com [lwa][/s2If] [s2If current_user_can(access_s2member_level4)]
- Western Texas Intermediate recovers some ground even though the US Dollar remains buoyant.
- IEA’s Director commented that China’s reopening would drive oil prices.
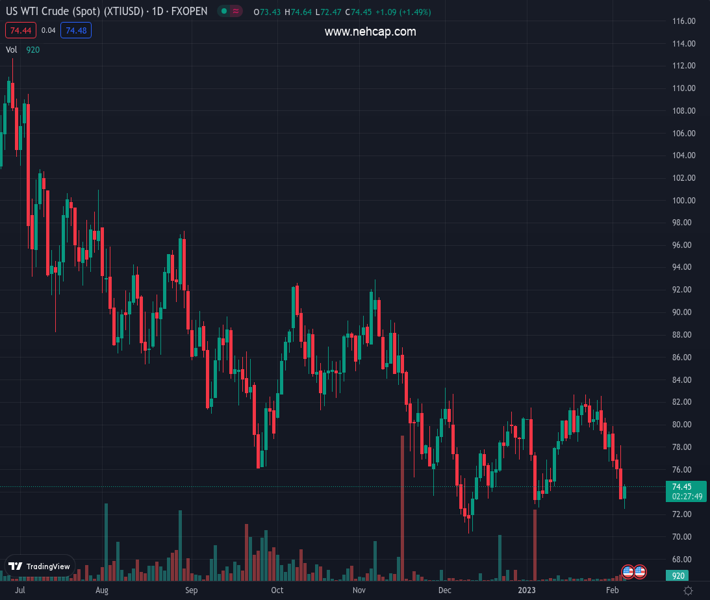
- WTI Technical Analysis: Triple bottom looms around $72.50.
The pair currently trades last at 74.31.
The previous day high was 78.18 while the previous day low was 73.36. The daily 38.2% Fib levels comes at 75.2, expected to provide resistance. Similarly, the daily 61.8% fib level is at 76.34, expected to provide resistance.
US crude oil benchmark known as Western Texas Intermediate (WTI) records minimal gains after diving toward an eight-week low at $72.30 per barrel on Monday, exchanging hands at around $73.96 per barrel, capped by a strong US Dollar (USD) across the board.
Wall Street’s extended its losses on Monday due to market participants repricing a less dovish Federal Reserve (Fed) as expected. Money market futures estimates 50 bps of rate hikes by the US central banks, which would lift the Fed Funds target to the 5%-5.25% range. Hence, the greenback continues to extend its recovery, as shown by the US Dollar Index, a measure of the buck’s value against a basket of six currencies, up 0.69%, at 103.703.
Since last Friday, WTI has slid 3%, following the robust US employment data.
Even though a strong US Dollar is a headwind for the “black gold,” China’s reopening prospects remain a driver for oil prices, as the International Energy Agency (IEA) Executive Director Fatih Birol reported. Birol commented that producers might reconsider their output policies as China’s Covid-19 relaxation would increase demand for crude. He added, “We expect about half of the growth in global oil demand this year will come from China.”
Oil traders should be aware that price caps on Russian products began on Sunday, as G7 nations, the EU and Australia, agreed on price limits of oil-refined Russian products.
Technically, WTI is still downward biased as long as the quote stands below $82.00 PB. Additionally, last Friday’s WTI failure to crack the 20-day Exponential Moving Average (EMA) at $77.65 exacerbated oil’s fall toward the year’s lows, at $72.30, breaking below the January 4 low of $72.50.
Nevertheless, since then, oil has rebounded and is aiming toward the $73.80 area, opening the door for a leg up. Hence, WTI’s first resistance would be $74.00. A breach of the latter will expose the 20-day EMA at 77.64, followed by the $78.00 psychological level, ahead of the 50-day EMA at $78.77. Conversely, WTI’s would resume downwards once it breaks beneath $72.30.
Technical Levels: Supports and Resistances
XTIUSD currently trading at 74.31 at the time of writing. Pair opened at 73.45 and is trading with a change of 1.17 % .
| Overview | Overview.1 | |
|---|---|---|
| 0 | Today last price | 74.31 |
| 1 | Today Daily Change | 0.86 |
| 2 | Today Daily Change % | 1.17 |
| 3 | Today daily open | 73.45 |
The pair remains strongly bearish on the daily time frame. It trades below the 20 SMA @ 78.81, 50 SMA 77.65, 100 SMA @ 81.12 and 200 SMA @ 90.77.
| Trends | Trends.1 | |
|---|---|---|
| 0 | Daily SMA20 | 78.81 |
| 1 | Daily SMA50 | 77.65 |
| 2 | Daily SMA100 | 81.12 |
| 3 | Daily SMA200 | 90.77 |
The previous day high was 78.18 while the previous day low was 73.36. The daily 38.2% Fib levels comes at 75.2, expected to provide resistance. Similarly, the daily 61.8% fib level is at 76.34, expected to provide resistance.
Note the levels of interest below:
- Pivot support is noted at 71.81, 70.17, 66.99
- Pivot resistance is noted at 76.63, 79.82, 81.45
| Levels | Levels.1 |
|---|---|
| Previous Daily High | 78.18 |
| Previous Daily Low | 73.36 |
| Previous Weekly High | 80.61 |
| Previous Weekly Low | 73.36 |
| Previous Monthly High | 82.68 |
| Previous Monthly Low | 72.64 |
| Daily Fibonacci 38.2% | 75.20 |
| Daily Fibonacci 61.8% | 76.34 |
| Daily Pivot Point S1 | 71.81 |
| Daily Pivot Point S2 | 70.17 |
| Daily Pivot Point S3 | 66.99 |
| Daily Pivot Point R1 | 76.63 |
| Daily Pivot Point R2 | 79.82 |
| Daily Pivot Point R3 | 81.45 |
[/s2If]
Join Our Telegram Group
")


