#USDCAD @ 1.34268 attracts some dip-buying on Monday amid a strong follow-through USD buying. (Pivot Orderbook analysis)
…
This is a premium post.
[s2If !current_user_can(access_s2member_level4)]Please register for PREMIUM VERSION HERE to read full post below containing analysis. In case of any error or you think you are not able to read the full post below, please email us at support#nehcap.com [lwa][/s2If] [s2If current_user_can(access_s2member_level4)]
- USD/CAD attracts some dip-buying on Monday amid a strong follow-through USD buying.
- An uptick in oil prices underpins the Loonie and caps any meaningful upside for the major.
- The fundamental backdrop still favours bulls and supports prospects for additional gains.
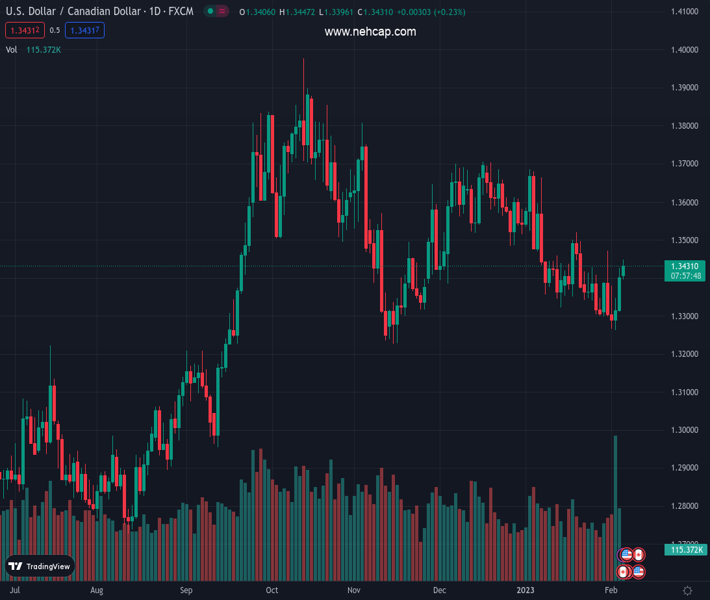
The pair currently trades last at 1.34268.
The previous day high was 1.3427 while the previous day low was 1.3308. The daily 38.2% Fib levels comes at 1.3381, expected to provide support. Similarly, the daily 61.8% fib level is at 1.3353, expected to provide support.
The USD/CAD pair reverses an intraday dip to sub-1.3400 levels and climbs to a four-day high during the first half of trading action on Monday. Spot prices, however, struggle to capitalize on the move and remain below mid-1.3400s through the early North American session.
The US Dollar builds on Friday’s solid bounce from a nine-month low and gains strong follow-through traction, which, in turn, acts as a tailwind for the USD/CAD pair. The upbeat US monthly employment details pointed to the underlying strength in the labor market and fueled speculations that the Fed will keep hiking interest rates to tame inflation. This continues to push the US Treasury bond yields higher and underpins the buck.
Meanwhile, expectations that the US central bank will stick to its hawkish stance for longer, along with fears of worsening US-China relations, take its toll on the global risk sentiment. This is evident from a sea of red across the equity markets, which is seen as another factor benefitting the safe-haven greenback. That said, an uptick in oil prices underpins the commodity-linked loonie and keeps a lid on any further gains for the USD/CAD pair.
Turkey’s oil terminal in Ceyhan halted after a major earthquake struck nearby early on Monday. This, along with price caps on Russian products that took effect on Sunday, raises supply concerns and provides a modest lift to oil prices. That said, the uncertainty about a strong recovery in the Chinese economy and looming recession risks might hold back bulls from placing aggressive bets around the black liquid, at least for the time being.
This, in turn, favours the USD/CAD bulls and supports prospects for a further near-term appreciating move. Hence, some follow-through strength beyond last week’s swing high, around the 1.3470 area, looks like a distinct possibility. The momentum could get extended further towards the 1.3500 psychological mark en route to a technically significant 100-day SMA support breakpoint, now turned resistance, currently around the 1.3525-1.3530 region.
Technical Levels: Supports and Resistances
USDCAD currently trading at 1.3426 at the time of writing. Pair opened at 1.3401 and is trading with a change of 0.19 % .
| Overview | Overview.1 | |
|---|---|---|
| 0 | Today last price | 1.3426 |
| 1 | Today Daily Change | 0.0025 |
| 2 | Today Daily Change % | 0.1900 |
| 3 | Today daily open | 1.3401 |
The pair is trading above its 20 Daily moving average @ 1.338, below its 50 Daily moving average @ 1.3499 , below its 100 Daily moving average @ 1.3534 and above its 200 Daily moving average @ 1.3222
| Trends | Trends.1 | |
|---|---|---|
| 0 | Daily SMA20 | 1.3380 |
| 1 | Daily SMA50 | 1.3499 |
| 2 | Daily SMA100 | 1.3534 |
| 3 | Daily SMA200 | 1.3222 |
The previous day high was 1.3427 while the previous day low was 1.3308. The daily 38.2% Fib levels comes at 1.3381, expected to provide support. Similarly, the daily 61.8% fib level is at 1.3353, expected to provide support.
Note the levels of interest below:
- Pivot support is noted at 1.333, 1.326, 1.3211
- Pivot resistance is noted at 1.3449, 1.3498, 1.3568
| Levels | Levels.1 |
|---|---|
| Previous Daily High | 1.3427 |
| Previous Daily Low | 1.3308 |
| Previous Weekly High | 1.3472 |
| Previous Weekly Low | 1.3262 |
| Previous Monthly High | 1.3685 |
| Previous Monthly Low | 1.3300 |
| Daily Fibonacci 38.2% | 1.3381 |
| Daily Fibonacci 61.8% | 1.3353 |
| Daily Pivot Point S1 | 1.3330 |
| Daily Pivot Point S2 | 1.3260 |
| Daily Pivot Point S3 | 1.3211 |
| Daily Pivot Point R1 | 1.3449 |
| Daily Pivot Point R2 | 1.3498 |
| Daily Pivot Point R3 | 1.3568 |
[/s2If]
Join Our Telegram Group
")


