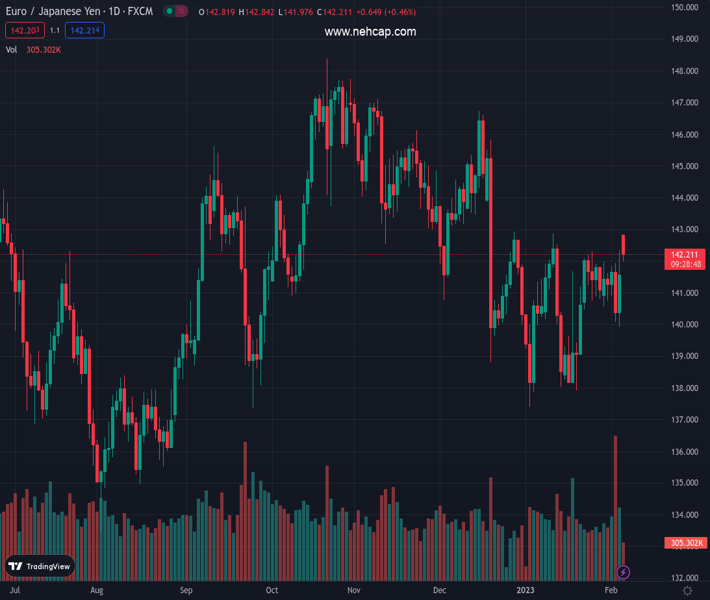
#EURJPY @ 142.218 advances further and flirts with YTD highs below 143.00. (Pivot Orderbook analysis)
…
This is a premium post.
[s2If !current_user_can(access_s2member_level4)]Please register for PREMIUM VERSION HERE to read full post below containing analysis. In case of any error or you think you are not able to read the full post below, please email us at support#nehcap.com [lwa][/s2If] [s2If current_user_can(access_s2member_level4)]
- EUR/JPY advances further and flirts with YTD highs below 143.00.
- Extra upside remains in store above the 200-day SMA (140.96).
The pair currently trades last at 142.218.
The previous day high was 142.34 while the previous day low was 139.93. The daily 38.2% Fib levels comes at 141.42, expected to provide support. Similarly, the daily 61.8% fib level is at 140.85, expected to provide support.
EUR/JPY adds to Friday’s strong advance and approaches the key 143.00 region at the beginning of the week.
EUR/JPY extends the recent sharp rebound and leaves behind the key 200-day SMA, today at 140.96, at the same time breaking above the multi-session consolidative theme and opening the door to potential extra gains in the very near term.
That said, the next up barrier of note now comes at the December 2022 peak at 146.72 (December 15).
Technical Levels: Supports and Resistances
EURJPY currently trading at 142.28 at the time of writing. Pair opened at 141.55 and is trading with a change of 0.52 % .
| Overview | Overview.1 | |
|---|---|---|
| 0 | Today last price | 142.28 |
| 1 | Today Daily Change | 87.00 |
| 2 | Today Daily Change % | 0.52 |
| 3 | Today daily open | 141.55 |
The pair is trading above its 20 Daily moving average @ 140.78, above its 50 Daily moving average @ 141.76 , below its 100 Daily moving average @ 142.98 and above its 200 Daily moving average @ 140.98
| Trends | Trends.1 | |
|---|---|---|
| 0 | Daily SMA20 | 140.78 |
| 1 | Daily SMA50 | 141.76 |
| 2 | Daily SMA100 | 142.98 |
| 3 | Daily SMA200 | 140.98 |
The previous day high was 142.34 while the previous day low was 139.93. The daily 38.2% Fib levels comes at 141.42, expected to provide support. Similarly, the daily 61.8% fib level is at 140.85, expected to provide support.
Note the levels of interest below:
- Pivot support is noted at 140.21, 138.86, 137.8
- Pivot resistance is noted at 142.62, 143.69, 145.03
| Levels | Levels.1 |
|---|---|
| Previous Daily High | 142.34 |
| Previous Daily Low | 139.93 |
| Previous Weekly High | 142.34 |
| Previous Weekly Low | 139.93 |
| Previous Monthly High | 142.86 |
| Previous Monthly Low | 137.39 |
| Daily Fibonacci 38.2% | 141.42 |
| Daily Fibonacci 61.8% | 140.85 |
| Daily Pivot Point S1 | 140.21 |
| Daily Pivot Point S2 | 138.86 |
| Daily Pivot Point S3 | 137.80 |
| Daily Pivot Point R1 | 142.62 |
| Daily Pivot Point R2 | 143.69 |
| Daily Pivot Point R3 | 145.03 |
[/s2If]
Join Our Telegram Group
")


