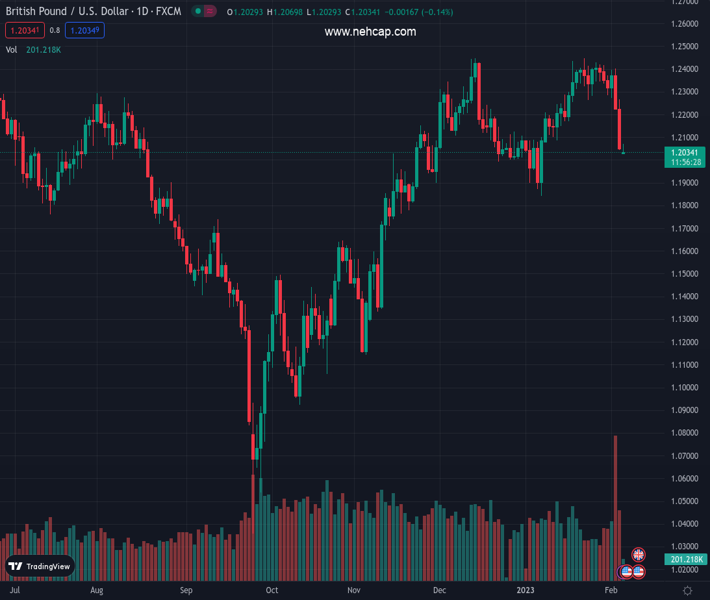
#GBPUSD @ 1.20334 rebounds from a one-month low touched on Monday, though lacks follow-through. (Pivot Orderbook analysis)
…
This is a premium post.
[s2If !current_user_can(access_s2member_level4)]Please register for PREMIUM VERSION HERE to read full post below containing analysis. In case of any error or you think you are not able to read the full post below, please email us at support#nehcap.com [lwa][/s2If] [s2If current_user_can(access_s2member_level4)]
- GBP/USD rebounds from a one-month low touched on Monday, though lacks follow-through.
- A combination of factors continues to push the USD higher and acts as a headwind for the pair.
- A dovish assessment of the BoE’s decision last week further contributes to capping the upside.
The pair currently trades last at 1.20334.
The previous day high was 1.2266 while the previous day low was 1.205. The daily 38.2% Fib levels comes at 1.2132, expected to provide resistance. Similarly, the daily 61.8% fib level is at 1.2183, expected to provide resistance.
The GBP/USD pair attracts some buyers near the 1.2030-1.2025 region and stages a modest recovery from a one-month low touched earlier this Monday. The pair hovers near the daily top, around the 1.2060 area through the first half of the European session, though lacks follow-through amid strong follow-through US Dollar buying.
In fact, the USD Index, which tracks the greenback against a basket of currencies, is seen building on Friday’s solid bounce from a nine-month low and drawing support from a combination of factors. The upbeat US monthly jobs report (NPF) forced investors to scale back their expectations for an imminent pause in the Fed’s policy-tightening cycle. This, in turn, pushes the US Treasury bond yields higher and continues to boost the greenback. Adding to this, the prevalent risk-off mood further seems to underpin the safe-haven buck and contributes to capping the upside for the GBP/USD pair.
Expectations that the US central bank will stick to its hawkish stance for longer fuel concerns about economic headwinds stemming from the continuous rise in borrowing costs. Adding to this, fears of worsening US-China relations take its toll on the global risk sentiment, which is evident from a generally weaker tone around the equity markets. In the latest blow to ties between the world’s two largest economies, Beijing on Monday stepped up its condemnation of Washington’s decision to shoot down a Chinese balloon. China claimed that the balloon had accidentally drifted into American airspace.
Apart from the aforementioned factors, a dovish assessment of the Bank of England (BoE) decision last week is also seen keeping a lid on the British Pound. The BoE, in its monetary policy statement, removed the phrase that they would “respond forcefully, as necessary”. Furthermore, BoE Governor Andrew Bailey said that inflation will continue to fall this year and more rapidly during the second half of 2023. This, in turn, suggests that the current rate-hiking cycle might be nearing the end and supports prospects for the emergence of fresh selling around the GBP/USD pair at higher levels.
On the economic data front, the UK Construction PMI remains in contraction territory for the second straight month and came in at 48.4 for January, down 48.8 previous. This further makes it prudent to wait for strong follow-through buying before confirming that the recent pullback from the 1.2445-1.2450 resistance zone, or a multi-month top has run its course. There isn’t any relevant market-moving economic data due for release from the US, leaving the buck at the mercy of the US bond yields. This, along with the broader risk sentiment, might provide some impetus to the GBP/USD pair.
Technical Levels: Supports and Resistances
GBPUSD currently trading at 1.2053 at the time of writing. Pair opened at 1.205 and is trading with a change of 0.02 % .
| Overview | Overview.1 | |
|---|---|---|
| 0 | Today last price | 1.2053 |
| 1 | Today Daily Change | 0.0003 |
| 2 | Today Daily Change % | 0.0200 |
| 3 | Today daily open | 1.2050 |
The pair is trading below its 20 Daily moving average @ 1.2289, below its 50 Daily moving average @ 1.219 , above its 100 Daily moving average @ 1.1804 and above its 200 Daily moving average @ 1.1955
| Trends | Trends.1 | |
|---|---|---|
| 0 | Daily SMA20 | 1.2289 |
| 1 | Daily SMA50 | 1.2190 |
| 2 | Daily SMA100 | 1.1804 |
| 3 | Daily SMA200 | 1.1955 |
The previous day high was 1.2266 while the previous day low was 1.205. The daily 38.2% Fib levels comes at 1.2132, expected to provide resistance. Similarly, the daily 61.8% fib level is at 1.2183, expected to provide resistance.
Note the levels of interest below:
- Pivot support is noted at 1.1979, 1.1907, 1.1763
- Pivot resistance is noted at 1.2194, 1.2337, 1.2409
| Levels | Levels.1 |
|---|---|
| Previous Daily High | 1.2266 |
| Previous Daily Low | 1.2050 |
| Previous Weekly High | 1.2418 |
| Previous Weekly Low | 1.2050 |
| Previous Monthly High | 1.2448 |
| Previous Monthly Low | 1.1841 |
| Daily Fibonacci 38.2% | 1.2132 |
| Daily Fibonacci 61.8% | 1.2183 |
| Daily Pivot Point S1 | 1.1979 |
| Daily Pivot Point S2 | 1.1907 |
| Daily Pivot Point S3 | 1.1763 |
| Daily Pivot Point R1 | 1.2194 |
| Daily Pivot Point R2 | 1.2337 |
| Daily Pivot Point R3 | 1.2409 |
[/s2If]
Join Our Telegram Group
")


