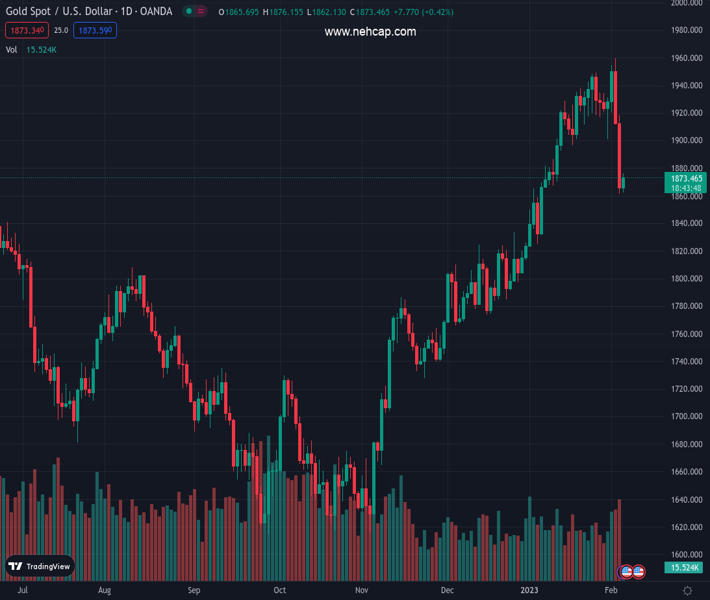
#XAUUSD @ 1,873.27 Gold price snaps two-day downtrend at the lowest levels in a month., @nehcap view: Further downside expected (Pivot Orderbook analysis)
…
This is a premium post.
[s2If !current_user_can(access_s2member_level4)]Please register for PREMIUM VERSION HERE to read full post below containing analysis. In case of any error or you think you are not able to read the full post below, please email us at support#nehcap.com [lwa][/s2If] [s2If current_user_can(access_s2member_level4)]
- Gold price snaps two-day downtrend at the lowest levels in a month.
- US Dollar bulls struggle ahead of Fed Chair Powell’s speech.
- Sino-American tussles renew as Washington shot down Chinese balloon.
The pair currently trades last at 1873.27.
The previous day high was 1918.65 while the previous day low was 1861.45. The daily 38.2% Fib levels comes at 1883.3, expected to provide resistance. Similarly, the daily 61.8% fib level is at 1896.8, expected to provide resistance.
Gold price (XAU/USD) consolidates the recent losses as it prints mild gains around $1,875 during early Monday, printing the first positive day in three around the one-month low. In doing so, the precious metal cheers the US Dollar’s inability to stay firmer, as well as takes clues from the US-China tussles, ahead of this week’s key events.
That said, the US Dollar Index (DXY) remains sidelined around 103.00, after posting a two-day rebound from the lowest levels since April 2022. In doing so, the greenback’s gauge versus the six major currencies struggles to justify the strong US jobs report and geopolitical fears surrounding China.
The weekend headlines suggesting the US military fighter jet shot down a suspected Chinese spy balloon off the coast of South Carolina weighed on the sentiment as US Secretary of State Antony Blinked called off his previously planned visit to Beijing following the event. In a reaction to the event, China President Xi Jinping termed this as an ‘obvious overreaction’.
The same joins strong US jobs report and ISM Services PMI data, published on Friday, to challenge the XAU/USD bulls ahead of Fed Chair Jerome Powell’s speech, up for publishing on Tuesday.
Amid these plays, S&P 500 Futures extend the previous day’s pullback from the highest levels since August, down 0.30% intraday near 4,140 by the press time. On the same line, the US 10-year Treasury bond yields remain firmer for the third consecutive day, to 3.56% by the press time, following the biggest weekly jump since late September 2022.
It’s worth noting that a lack of major data seemed to have triggered the XAU/USD rebound from the short-term support but the Gold buyers should remain cautious amid recently hawkish Fed concerns and the US-China tension. Also important to watch will be Friday’s US UoM Consumer Sentiment Index for February, as well as the University of Michigan’s 5-year Consumer Inflation expectations.
Gold price bounces off a seven-week-old ascending trend line, as well as crossing the monthly horizontal hurdle, as XAU/USD bulls approach the 200-Simple Moving Average (SMA) level surrounding $1,880.
The corrective pullback also takes clues from the oversold RSI (14). However, bearish MACD signals and the inability to cross the 200-SMA hurdle keep Gold sellers hopeful.
Even so, the metal’s fresh downside needs validation from the aforementioned support line, close to $1,860 by the press time.
On the contrary, an upside break of the 200-SMA hurdle surrounding $1,880 could direct Gold buyers toward the $1,900 threshold.
Following that, an upward-sloping resistance line from January 16, close to $1,965, as well as the March 2022 peak of around $1,966, will be crucial to watch for Gold buyers to tackle to keep the reins.
Trend: Further downside expected
Technical Levels: Supports and Resistances
XAUUSD currently trading at 1873.56 at the time of writing. Pair opened at 1864.86 and is trading with a change of 0.47% % .
| Overview | Overview.1 | |
|---|---|---|
| 0 | Today last price | 1873.56 |
| 1 | Today Daily Change | 8.70 |
| 2 | Today Daily Change % | 0.47% |
| 3 | Today daily open | 1864.86 |
The pair is trading below its 20 Daily moving average @ 1914.36, above its 50 Daily moving average @ 1846.04 , above its 100 Daily moving average @ 1766.47 and above its 200 Daily moving average @ 1775.99
| Trends | Trends.1 | |
|---|---|---|
| 0 | Daily SMA20 | 1914.36 |
| 1 | Daily SMA50 | 1846.04 |
| 2 | Daily SMA100 | 1766.47 |
| 3 | Daily SMA200 | 1775.99 |
The previous day high was 1918.65 while the previous day low was 1861.45. The daily 38.2% Fib levels comes at 1883.3, expected to provide resistance. Similarly, the daily 61.8% fib level is at 1896.8, expected to provide resistance.
Note the levels of interest below:
- Pivot support is noted at 1844.66, 1824.45, 1787.46
- Pivot resistance is noted at 1901.86, 1938.85, 1959.06
| Levels | Levels.1 |
|---|---|
| Previous Daily High | 1918.65 |
| Previous Daily Low | 1861.45 |
| Previous Weekly High | 1959.80 |
| Previous Weekly Low | 1861.45 |
| Previous Monthly High | 1949.27 |
| Previous Monthly Low | 1823.76 |
| Daily Fibonacci 38.2% | 1883.30 |
| Daily Fibonacci 61.8% | 1896.80 |
| Daily Pivot Point S1 | 1844.66 |
| Daily Pivot Point S2 | 1824.45 |
| Daily Pivot Point S3 | 1787.46 |
| Daily Pivot Point R1 | 1901.86 |
| Daily Pivot Point R2 | 1938.85 |
| Daily Pivot Point R3 | 1959.06 |
[/s2If]
Join Our Telegram Group
")


