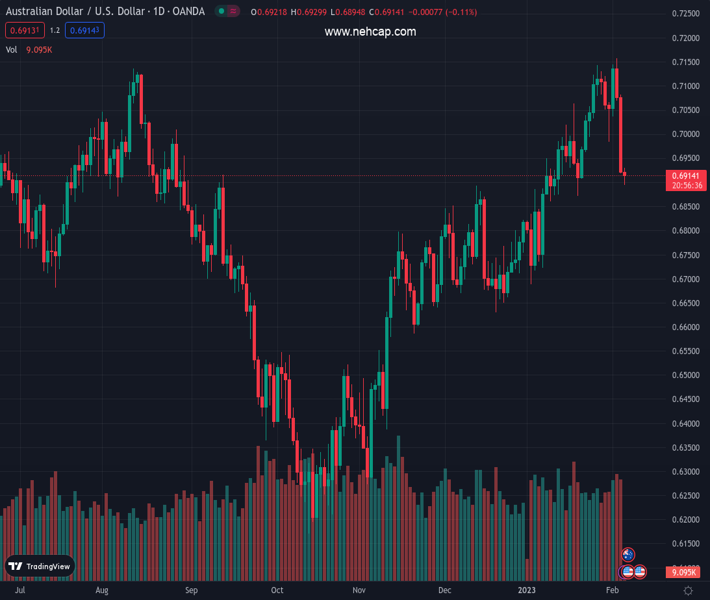
#AUDUSD @ 0.69133 is showing a rebound move from 0.6900 as Australian Retail Sales contracted by 0.2% vs. -0.6% the expectations. (Pivot Orderbook analysis)
…
This is a premium post.
[s2If !current_user_can(access_s2member_level4)]Please register for PREMIUM VERSION HERE to read full post below containing analysis. In case of any error or you think you are not able to read the full post below, please email us at support#nehcap.com [lwa][/s2If] [s2If current_user_can(access_s2member_level4)]
- AUD/USD is showing a rebound move from 0.6900 as Australian Retail Sales contracted by 0.2% vs. -0.6% the expectations.
- A 25 bps interest rate hike is expected from the RBA this week.
- A sheer rebound in the US Treasury yields has strengthened the risk-aversion theme.
The pair currently trades last at 0.69133.
The previous day high was 0.7088 while the previous day low was 0.6919. The daily 38.2% Fib levels comes at 0.6983, expected to provide resistance. Similarly, the daily 61.8% fib level is at 0.7023, expected to provide resistance.
The AUD/USD pair has attempted a recovery of around 0.6900 as the Australian Bureau of Statistics has reported a lower-than-expected contraction in the Retail Sales data for the fourth quarter of CY2022. The economic data has contracted by 0.2% while the street was expected a contraction by 0.6%.
The major catalyst that will trigger volatility in the Australian Dollar will be the announcement of the interest rate decision by the Reserve Bank of Australia (RBA), which is scheduled for Tuesday. Projections for policy stance are extremely hawkish as Australian Consumer Price Index (CPI) has yet not confirmed its peak. The Australian inflation recorded fresh highs of 7.8% in the fourth quarter of CY2022.
Analyst at Deutsche Bank Australia sees the RBA likely to drive the Official Cash Rate (OCR) to 4.1%, citing the most recent inflation update of a 7.8% increase in the CPI, which was slightly higher than expected. “While the RBA will likely move more slowly in 2023 than it did in 2022, we now expect four more 25 basis point hikes this year: 25 basis points in each of February and March, and 25 basis points each at the May and August meetings” as reported by Forbes Advisor.
Meanwhile, the risk profile is supporting the safe-haven assets after a gigantic jump in the United States Nonfarm Payrolls (NFP) numbers. The US Dollar Index (DXY) is aiming to shift its auction profile above 102.50. S&P500 futures have continued their downside move in the Asian session, portraying a further decline in the risk appetite of the market participants. The 10-year US Treasury yields have escalated further to near 3.57%.
Technical Levels: Supports and Resistances
AUDUSD currently trading at 0.6916 at the time of writing. Pair opened at 0.6923 and is trading with a change of -0.1 % .
| Overview | Overview.1 | |
|---|---|---|
| 0 | Today last price | 0.6916 |
| 1 | Today Daily Change | -0.0007 |
| 2 | Today Daily Change % | -0.1000 |
| 3 | Today daily open | 0.6923 |
The pair is trading below its 20 Daily moving average @ 0.7003, above its 50 Daily moving average @ 0.6851 , above its 100 Daily moving average @ 0.667 and above its 200 Daily moving average @ 0.6811
| Trends | Trends.1 | |
|---|---|---|
| 0 | Daily SMA20 | 0.7003 |
| 1 | Daily SMA50 | 0.6851 |
| 2 | Daily SMA100 | 0.6670 |
| 3 | Daily SMA200 | 0.6811 |
The previous day high was 0.7088 while the previous day low was 0.6919. The daily 38.2% Fib levels comes at 0.6983, expected to provide resistance. Similarly, the daily 61.8% fib level is at 0.7023, expected to provide resistance.
Note the levels of interest below:
- Pivot support is noted at 0.6865, 0.6808, 0.6697
- Pivot resistance is noted at 0.7034, 0.7145, 0.7202
| Levels | Levels.1 |
|---|---|
| Previous Daily High | 0.7088 |
| Previous Daily Low | 0.6919 |
| Previous Weekly High | 0.7158 |
| Previous Weekly Low | 0.6919 |
| Previous Monthly High | 0.7143 |
| Previous Monthly Low | 0.6688 |
| Daily Fibonacci 38.2% | 0.6983 |
| Daily Fibonacci 61.8% | 0.7023 |
| Daily Pivot Point S1 | 0.6865 |
| Daily Pivot Point S2 | 0.6808 |
| Daily Pivot Point S3 | 0.6697 |
| Daily Pivot Point R1 | 0.7034 |
| Daily Pivot Point R2 | 0.7145 |
| Daily Pivot Point R3 | 0.7202 |
[/s2If]
Join Our Telegram Group
")


