#EURUSD @ 1.07867 remains sidelined after breaking short-term important support., @nehcap view: Further downside expected (Pivot Orderbook analysis)
…
This is a premium post.
[s2If !current_user_can(access_s2member_level4)]Please register for PREMIUM VERSION HERE to read full post below containing analysis. In case of any error or you think you are not able to read the full post below, please email us at support#nehcap.com [lwa][/s2If] [s2If current_user_can(access_s2member_level4)]
- EUR/USD remains sidelined after breaking short-term important support.
- Bearish MACD signals, steady RSI favor sellers targeting previous resistance line.
- Convergence of 100-EMA, 200-EMA appears a tough nut to crack for EUR/USD bears.
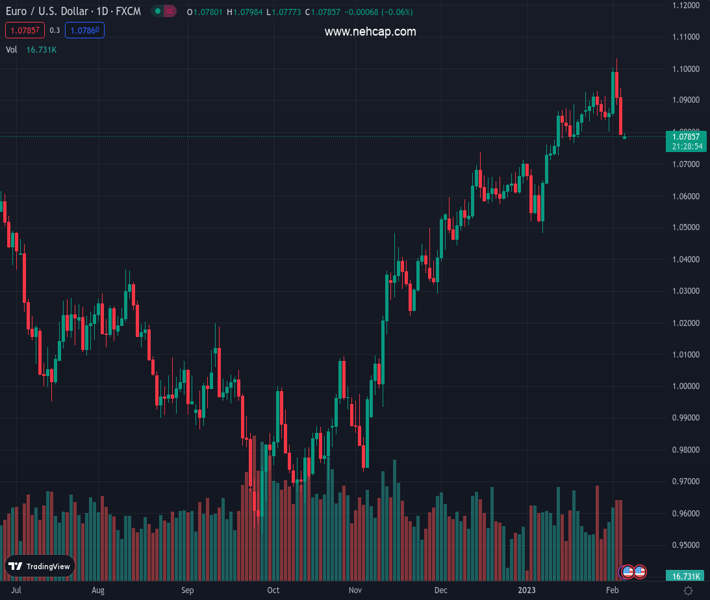
The pair currently trades last at 1.07867.
The previous day high was 1.094 while the previous day low was 1.0793. The daily 38.2% Fib levels comes at 1.0849, expected to provide resistance. Similarly, the daily 61.8% fib level is at 1.0884, expected to provide resistance.
EUR/USD licks its wounds around 1.0790 after a two-day pullback from the highest levels since April 2022. Even so, the major currency pair defends the previous day’s break of the 21-day Exponential Moving Average (EMA) and an upward-sloping support line from early November 2022.
Not only the sustained downside break of the previous key support confluence but the bearish MACD signals and steady RSI (14) also keeps the EUR/USD sellers hopeful.
That said, a seven-week-old resistance-turned-support line near 1.0660 appears the immediate target for the EUR/USD bears to watch before aiming for the 1.0500 support confluence including the 100-EMA and 200-EMA.
It’s worth noting that the previous monthly low near 1.0480 acts as an extra filter towards the south before welcoming the EUR/USD bears.
On the flip side, the 21-day EMA and the three-month-old previous support line challenge the EUR/USD bulls near 1.0820.
Following that, multiple levels near 1.0900 and 1.0920 could test the pair’s further upside before highlighting the latest peak surrounding 1.1035.
In a case where EUR/USD remains firmer past 1.1035, the odds of witnessing a rally toward the March 2022 high near 1.1185 can’t be ruled out.
Overall, EUR/USD remains on the bear’s radar despite the latest inaction.
Trend: Further downside expected
Technical Levels: Supports and Resistances
EURUSD currently trading at 1.0787 at the time of writing. Pair opened at 1.0793 and is trading with a change of -0.06% % .
| Overview | Overview.1 | |
|---|---|---|
| 0 | Today last price | 1.0787 |
| 1 | Today Daily Change | -0.0006 |
| 2 | Today Daily Change % | -0.06% |
| 3 | Today daily open | 1.0793 |
The pair is trading below its 20 Daily moving average @ 1.0842, above its 50 Daily moving average @ 1.0677 , above its 100 Daily moving average @ 1.032 and above its 200 Daily moving average @ 1.0319
| Trends | Trends.1 | |
|---|---|---|
| 0 | Daily SMA20 | 1.0842 |
| 1 | Daily SMA50 | 1.0677 |
| 2 | Daily SMA100 | 1.0320 |
| 3 | Daily SMA200 | 1.0319 |
The previous day high was 1.094 while the previous day low was 1.0793. The daily 38.2% Fib levels comes at 1.0849, expected to provide resistance. Similarly, the daily 61.8% fib level is at 1.0884, expected to provide resistance.
Note the levels of interest below:
- Pivot support is noted at 1.0744, 1.0695, 1.0597
- Pivot resistance is noted at 1.0891, 1.0989, 1.1038
| Levels | Levels.1 |
|---|---|
| Previous Daily High | 1.0940 |
| Previous Daily Low | 1.0793 |
| Previous Weekly High | 1.1033 |
| Previous Weekly Low | 1.0793 |
| Previous Monthly High | 1.0930 |
| Previous Monthly Low | 1.0483 |
| Daily Fibonacci 38.2% | 1.0849 |
| Daily Fibonacci 61.8% | 1.0884 |
| Daily Pivot Point S1 | 1.0744 |
| Daily Pivot Point S2 | 1.0695 |
| Daily Pivot Point S3 | 1.0597 |
| Daily Pivot Point R1 | 1.0891 |
| Daily Pivot Point R2 | 1.0989 |
| Daily Pivot Point R3 | 1.1038 |
[/s2If]
Join Our Telegram Group
")


