#XAGUSD @ 22.265 Silver price pares the biggest daily loss in a year with mild gains., @nehcap view: Recovery expected (Pivot Orderbook analysis)
…
This is a premium post.
[s2If !current_user_can(access_s2member_level4)]Please register for PREMIUM VERSION HERE to read full post below containing analysis. In case of any error or you think you are not able to read the full post below, please email us at support#nehcap.com [lwa][/s2If] [s2If current_user_can(access_s2member_level4)]
- Silver price pares the biggest daily loss in a year with mild gains.
- Convergence of 100-EMA, 50% Fibonacci retracement level probes bears.
- Downbeat RSI, failure to break key support tease short-term XAG/USD buyers.
- Bulls need to cross 61.8% Fibonacci retracement to retake control.
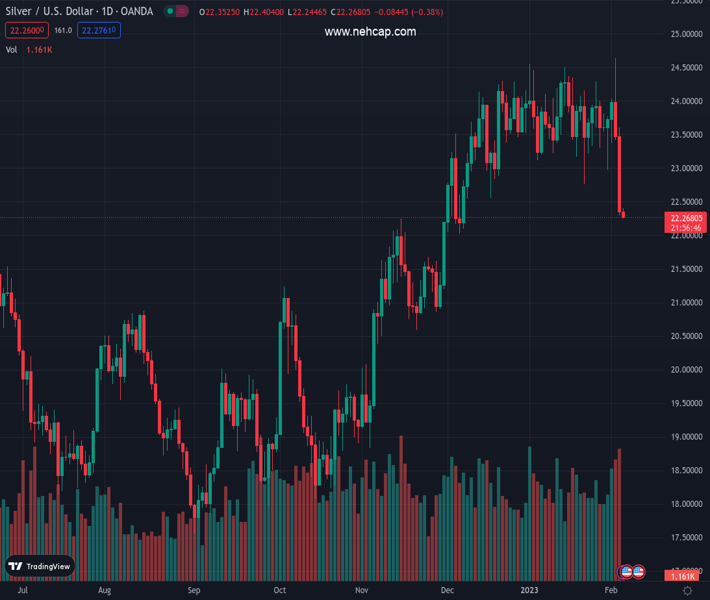
The pair currently trades last at 22.265.
The previous day high was 23.61 while the previous day low was 22.29. The daily 38.2% Fib levels comes at 22.79, expected to provide resistance. Similarly, the daily 61.8% fib level is at 23.1, expected to provide resistance.
Silver price (XAG/USD) remains on the recovery mode as it prints mild gains around $22.40 during early Monday morning in Asia. In doing so, the bright metal pares the biggest daily loss in a year at the lowest levels in two months.
The 100-day Exponential Moving Average (EMA) joins the 50% Fibonacci retracement level of the metal’s March-September 2022 downturn to highlight the $22.30-25 support confluence that recently triggered the XAG/USD rebound.
Adding strength to the recovery moves is the downbeat RSI (14) that challenges Silver bears.
However, bearish MACD signals join the quote’s sustained downside break of the 61.8% Fibonacci retracement level surrounding $23.40, also known as the golden level, which keeps the Silver bears hopeful.
Even if the XAG/USD manages to cross the $23.40 hurdle, a one-month-old horizontal resistance area around $24.55-65 will be crucial for the bulls to cross to retake control.
Alternatively, a downside break of the $22.30-25 support confluence has another chance of pushing back the Silver bears in the form of the 200-EMA, close to $21.95 by the press time.
In a case where XAG/USD remains bearish past $21.95, the previous resistance line from the last March, near $20.80, will be in focus.
Trend: Recovery expected
Technical Levels: Supports and Resistances
XAGUSD currently trading at 22.35 at the time of writing. Pair opened at 22.35 and is trading with a change of 0.00% % .
| Overview | Overview.1 | |
|---|---|---|
| 0 | Today last price | 22.35 |
| 1 | Today Daily Change | 0.00 |
| 2 | Today Daily Change % | 0.00% |
| 3 | Today daily open | 22.35 |
The pair is trading below its 20 Daily moving average @ 23.69, below its 50 Daily moving average @ 23.42 , above its 100 Daily moving average @ 21.69 and above its 200 Daily moving average @ 21.02
| Trends | Trends.1 | |
|---|---|---|
| 0 | Daily SMA20 | 23.69 |
| 1 | Daily SMA50 | 23.42 |
| 2 | Daily SMA100 | 21.69 |
| 3 | Daily SMA200 | 21.02 |
The previous day high was 23.61 while the previous day low was 22.29. The daily 38.2% Fib levels comes at 22.79, expected to provide resistance. Similarly, the daily 61.8% fib level is at 23.1, expected to provide resistance.
Note the levels of interest below:
- Pivot support is noted at 21.89, 21.43, 20.58
- Pivot resistance is noted at 23.21, 24.06, 24.52
| Levels | Levels.1 |
|---|---|
| Previous Daily High | 23.61 |
| Previous Daily Low | 22.29 |
| Previous Weekly High | 24.64 |
| Previous Weekly Low | 22.29 |
| Previous Monthly High | 24.55 |
| Previous Monthly Low | 22.76 |
| Daily Fibonacci 38.2% | 22.79 |
| Daily Fibonacci 61.8% | 23.10 |
| Daily Pivot Point S1 | 21.89 |
| Daily Pivot Point S2 | 21.43 |
| Daily Pivot Point S3 | 20.58 |
| Daily Pivot Point R1 | 23.21 |
| Daily Pivot Point R2 | 24.06 |
| Daily Pivot Point R3 | 24.52 |
[/s2If]
Join Our Telegram Group
")


