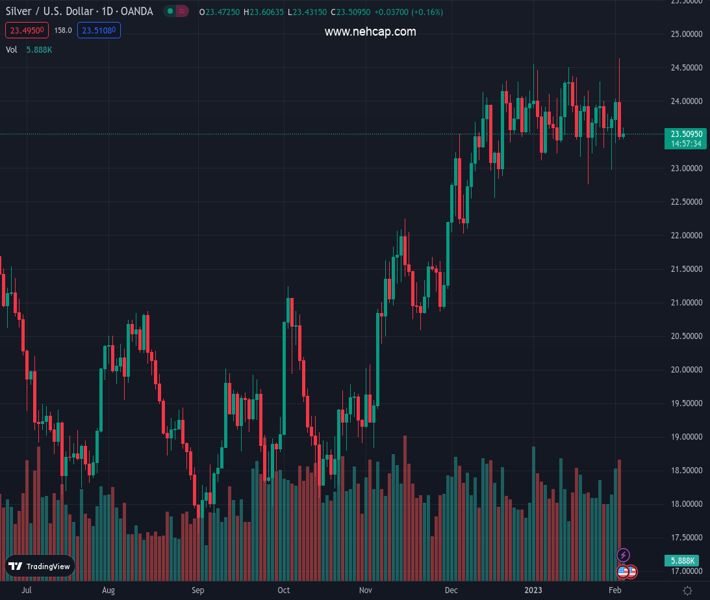
#XAGUSD @ 23.511 Silver edges higher on Friday, albeit the intraday uptick lacks follow-through. (Pivot Orderbook analysis)
…
This is a premium post.
[s2If !current_user_can(access_s2member_level4)]Please register for PREMIUM VERSION HERE to read full post below containing analysis. In case of any error or you think you are not able to read the full post below, please email us at support#nehcap.com [lwa][/s2If] [s2If current_user_can(access_s2member_level4)]
- Silver edges higher on Friday, albeit the intraday uptick lacks follow-through.
- The overnight failure near the $24.50 supply zone warrants caution for bulls
- .Sustained break below the $23.00 mark is needed to confirm negative bias.
The pair currently trades last at 23.511.
The previous day high was 24.64 while the previous day low was 23.42. The daily 38.2% Fib levels comes at 23.89, expected to provide resistance. Similarly, the daily 61.8% fib level is at 24.17, expected to provide resistance.
Silver attracts some buyers near the 50-day SMA on Friday and stalls the previous day’s retracement slide from its highest level since April 2022. The white metal sticks to a mildly positive tone through the early European session, though the intraday uptick lacks bullish conviction.
Looking at the broader picture, the XAG/USD has been oscillating in a familiar band over the past one-and-half month or so, forming a rectangle pattern on the daily chart. This points to indecision among traders and warrants some caution before placing aggressive directional bets. The overnight failure to find acceptance above the $24.50 supply zone validates the trading range resistance, which should now act as a pivotal point.
Given that technical indicators on the daily chart have just started drifting in the negative territory, it will be prudent to wait for a sustained move beyond the said barrier before placing bullish bets. The XAG/USD might then aim to reclaim the $25.00 psychological mark for the first time since April 2022. The momentum could get extended towards the next relevant hurdle near the $25.35 region en route to the $26.00 round figure.
On the flip side, any further slide below the $23.40-$23.30 horizontal zone might continue to find decent support near the $23.00-$22.95 region. This is followed by support near the $22.75 area, which if broken decisively could drag the XAG/USD to the next relevant support near the $22.20-$22.15 zone ahead of the $22.00 mark.
Technical Levels: Supports and Resistances
XAGUSD currently trading at 23.53 at the time of writing. Pair opened at 23.46 and is trading with a change of 0.3 % .
| Overview | Overview.1 | |
|---|---|---|
| 0 | Today last price | 23.53 |
| 1 | Today Daily Change | 0.07 |
| 2 | Today Daily Change % | 0.30 |
| 3 | Today daily open | 23.46 |
The pair is trading below its 20 Daily moving average @ 23.76, above its 50 Daily moving average @ 23.41 , above its 100 Daily moving average @ 21.66 and above its 200 Daily moving average @ 21.02
| Trends | Trends.1 | |
|---|---|---|
| 0 | Daily SMA20 | 23.76 |
| 1 | Daily SMA50 | 23.41 |
| 2 | Daily SMA100 | 21.66 |
| 3 | Daily SMA200 | 21.02 |
The previous day high was 24.64 while the previous day low was 23.42. The daily 38.2% Fib levels comes at 23.89, expected to provide resistance. Similarly, the daily 61.8% fib level is at 24.17, expected to provide resistance.
Note the levels of interest below:
- Pivot support is noted at 23.04, 22.63, 21.83
- Pivot resistance is noted at 24.26, 25.06, 25.47
| Levels | Levels.1 |
|---|---|
| Previous Daily High | 24.64 |
| Previous Daily Low | 23.42 |
| Previous Weekly High | 24.30 |
| Previous Weekly Low | 22.76 |
| Previous Monthly High | 24.55 |
| Previous Monthly Low | 22.76 |
| Daily Fibonacci 38.2% | 23.89 |
| Daily Fibonacci 61.8% | 24.17 |
| Daily Pivot Point S1 | 23.04 |
| Daily Pivot Point S2 | 22.63 |
| Daily Pivot Point S3 | 21.83 |
| Daily Pivot Point R1 | 24.26 |
| Daily Pivot Point R2 | 25.06 |
| Daily Pivot Point R3 | 25.47 |
[/s2If]
Join Our Telegram Group
")


