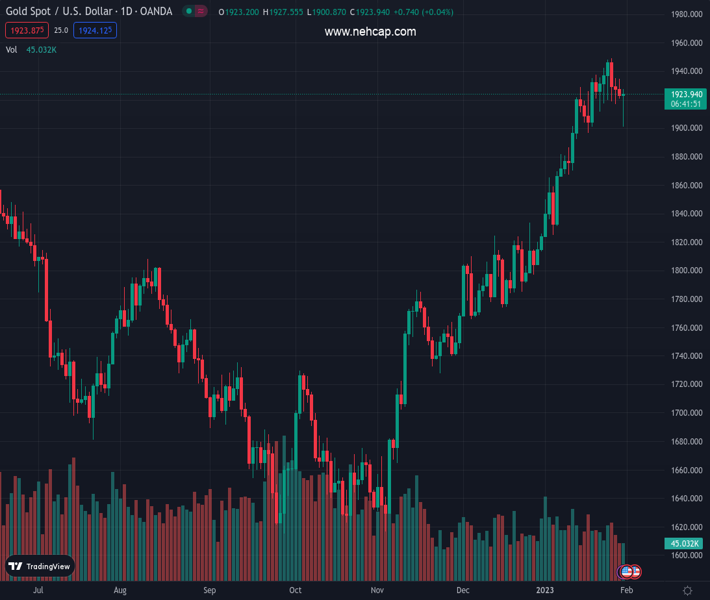
#XAUUSD @ 1,922.73 US Dollar weakens following Q4 US Employment Cost Index. (Pivot Orderbook analysis)
…
This is a premium post.
[s2If !current_user_can(access_s2member_level4)]Please register for PREMIUM VERSION HERE to read full post below containing analysis. In case of any error or you think you are not able to read the full post below, please email us at support#nehcap.com [lwa][/s2If] [s2If current_user_can(access_s2member_level4)]
- US Dollar weakens following Q4 US Employment Cost Index.
- Data points to more evidence of a slow down in inflation.
- XAU/USD erases daily losses with a rebound of more than $10.
The pair currently trades last at 1922.73.
The previous day high was 1934.54 while the previous day low was 1920.67. The daily 38.2% Fib levels comes at 1925.97, expected to provide resistance. Similarly, the daily 61.8% fib level is at 1929.24, expected to provide resistance.
Gold prices bounced sharply higher following the release of US labor costs data for the fourth quarter. More evidence of a slowdown in inflation pushed US yields to the downside and Wall Street to the upside, weakening the greenback.
The Employment Cost Index (ECI) rose 1% in the fourth quarter, below the 1.1% of market consensus and marked the third consecutive slowdown. Still the index is up by 4% compared to a year ago. The evidence of an improvement in the inflation outlook boosted US yields ahead of Wednesday’s FOMC decision.
Still the numbers are high, suggesting that inflation is still not consistent with Fed’s target. “Even as supply chain pressures ease, commodity prices cool and housing costs temper, we think the FOMC still wants to see a bit more slowing in wage growth before the Committee feels confident inflation is firmly headed to 2% over the medium term”, said analysts at Wells Fargo.
The greenback tumbled after the report and also did Treasuries, boosting gold. Also equity and crude oil price rose. XAU/USD erased all losses and it is hovering around daily highs at $1,927.
Earlier on Tuesday, gold bottomed at $1,900 a critical support. Now price is back above the $1,920 zone, another relevant technical area. If it remains above, a test of $1,935 will be on the cards.
Technical Levels: Supports and Resistances
XAUUSD currently trading at 1920.95 at the time of writing. Pair opened at 1922.14 and is trading with a change of -0.06 % .
| Overview | Overview.1 | |
|---|---|---|
| 0 | Today last price | 1920.95 |
| 1 | Today Daily Change | -1.19 |
| 2 | Today Daily Change % | -0.06 |
| 3 | Today daily open | 1922.14 |
The pair remains strongly bullish on the daily timeframe. It trades above its 20 SMA @ 1901.06, 50 SMA 1832.91, 100 SMA @ 1757.26 and 200 SMA @ 1775.6.
| Trends | Trends.1 | |
|---|---|---|
| 0 | Daily SMA20 | 1901.06 |
| 1 | Daily SMA50 | 1832.91 |
| 2 | Daily SMA100 | 1757.26 |
| 3 | Daily SMA200 | 1775.60 |
The previous day high was 1934.54 while the previous day low was 1920.67. The daily 38.2% Fib levels comes at 1925.97, expected to provide resistance. Similarly, the daily 61.8% fib level is at 1929.24, expected to provide resistance.
Note the levels of interest below:
- Pivot support is noted at 1917.03, 1911.91, 1903.16
- Pivot resistance is noted at 1930.9, 1939.65, 1944.77
| Levels | Levels.1 |
|---|---|
| Previous Daily High | 1934.54 |
| Previous Daily Low | 1920.67 |
| Previous Weekly High | 1949.27 |
| Previous Weekly Low | 1911.45 |
| Previous Monthly High | 1833.38 |
| Previous Monthly Low | 1765.89 |
| Daily Fibonacci 38.2% | 1925.97 |
| Daily Fibonacci 61.8% | 1929.24 |
| Daily Pivot Point S1 | 1917.03 |
| Daily Pivot Point S2 | 1911.91 |
| Daily Pivot Point S3 | 1903.16 |
| Daily Pivot Point R1 | 1930.90 |
| Daily Pivot Point R2 | 1939.65 |
| Daily Pivot Point R3 | 1944.77 |
[/s2If]
Join Our Telegram Group


