#AUDUSD @ 0.70186 continues losing ground for the second straight day and drops to a one-week low. (Pivot Orderbook analysis)
…
This is a premium post.
[s2If !current_user_can(access_s2member_level4)]Please register for PREMIUM VERSION HERE to read full post below containing analysis. In case of any error or you think you are not able to read the full post below, please email us at support#nehcap.com [lwa][/s2If] [s2If current_user_can(access_s2member_level4)]
- AUD/USD continues losing ground for the second straight day and drops to a one-week low.
- The dismal Australian data weighs on the domestic currency amid a modest USD strength.
- Traders look to the US macro data for a fresh impetus ahead of the FOMC on Wednesday.
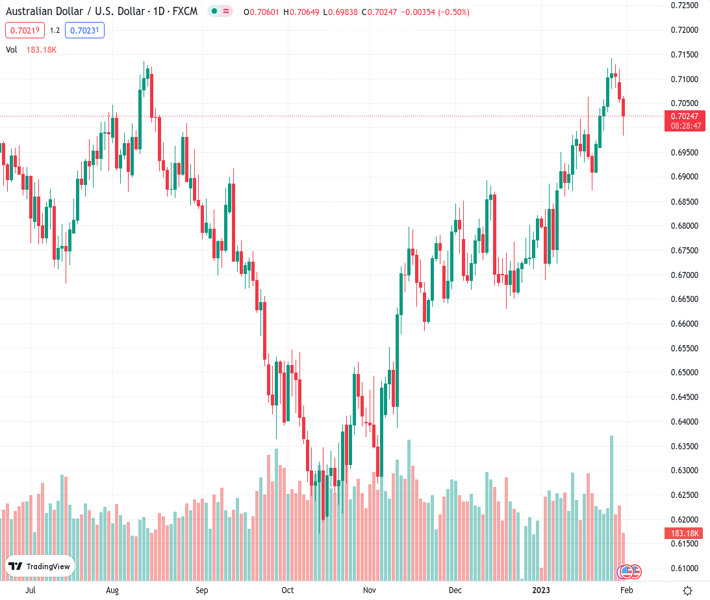
The pair currently trades last at 0.70186.
The previous day high was 0.712 while the previous day low was 0.7051. The daily 38.2% Fib levels comes at 0.7078, expected to provide resistance. Similarly, the daily 61.8% fib level is at 0.7094, expected to provide resistance.
The AUD/USD pair remains under heavy selling pressure for the second straight day on Tuesday and drops to over a one-week low heading into the North American session. The pair is currently placed around the 0.7000 psychological mark and seems vulnerable to prolonging its recent pullback from the highest level since June 2022 touched last week.
The Australian Dollar weakens across the board in reaction to the dismal domestic macro data, which showed that Retail Sales slumped 3.9% in December amid the persistent rise in prices. Furthermore, investors are increasingly pessimistic about the economic outlook amid expectations that additional rate hikes by the Reserve Bank of Australia (RBA) will contribute to the cost of living crisis. This, along with a modest US Dollar strength, exerts downward pressure on the AUD/USD pair.
The worst COVID-19 outbreak in China raises uncertainty about a strong recovery in the world’s second-largest economy and continues to weigh on investors’ sentiment. This is evident from a generally weaker tone around the equity markets, which is driving some haven flows towards the buck and weighing on the risk-sensitive Aussie. The USD uptick could also be attributed to some repositioning trade ahead of the highly-anticipated FOMC monetary policy decision, due to be announced on Wednesday.
The Fed is expected to further slow the pace of its policy-tightening cycle and deliver a smaller 25 bps rate hike. The recent US macro data, however, point to an economy that is resilient despite the rapidly rising borrowing costs and backs the case for the Fed to stick to its hawkish stance for longer. This, in turn, prompts traders to lighten their USD bearish positions, though a downtick in the US Treasury bond yields keeps a lid on any meaningful upside, at least for now.
Heading into the key central bank event risk, traders on Tuesday will take cues from the US economic docket, featuring the Chicago PMI and the Conference Board’s Consumer Confidence Index. This, along with the US bond yields and the broader risk sentiment, might influence the USD price dynamics and provide some impetus to the AUD/USD pair.
Technical Levels: Supports and Resistances
AUDUSD currently trading at 0.7 at the time of writing. Pair opened at 0.7058 and is trading with a change of -0.82 % .
| Overview | Overview.1 | |
|---|---|---|
| 0 | Today last price | 0.7000 |
| 1 | Today Daily Change | -0.0058 |
| 2 | Today Daily Change % | -0.8200 |
| 3 | Today daily open | 0.7058 |
The pair remains strongly bullish on the daily timeframe. It trades above its 20 SMA @ 0.6954, 50 SMA 0.6825, 100 SMA @ 0.6657 and 200 SMA @ 0.6812.
| Trends | Trends.1 | |
|---|---|---|
| 0 | Daily SMA20 | 0.6954 |
| 1 | Daily SMA50 | 0.6825 |
| 2 | Daily SMA100 | 0.6657 |
| 3 | Daily SMA200 | 0.6812 |
The previous day high was 0.712 while the previous day low was 0.7051. The daily 38.2% Fib levels comes at 0.7078, expected to provide resistance. Similarly, the daily 61.8% fib level is at 0.7094, expected to provide resistance.
Note the levels of interest below:
- Pivot support is noted at 0.7033, 0.7007, 0.6964
- Pivot resistance is noted at 0.7102, 0.7146, 0.7171
| Levels | Levels.1 |
|---|---|
| Previous Daily High | 0.7120 |
| Previous Daily Low | 0.7051 |
| Previous Weekly High | 0.7143 |
| Previous Weekly Low | 0.6960 |
| Previous Monthly High | 0.6893 |
| Previous Monthly Low | 0.6629 |
| Daily Fibonacci 38.2% | 0.7078 |
| Daily Fibonacci 61.8% | 0.7094 |
| Daily Pivot Point S1 | 0.7033 |
| Daily Pivot Point S2 | 0.7007 |
| Daily Pivot Point S3 | 0.6964 |
| Daily Pivot Point R1 | 0.7102 |
| Daily Pivot Point R2 | 0.7146 |
| Daily Pivot Point R3 | 0.7171 |
[/s2If]
Join Our Telegram Group


