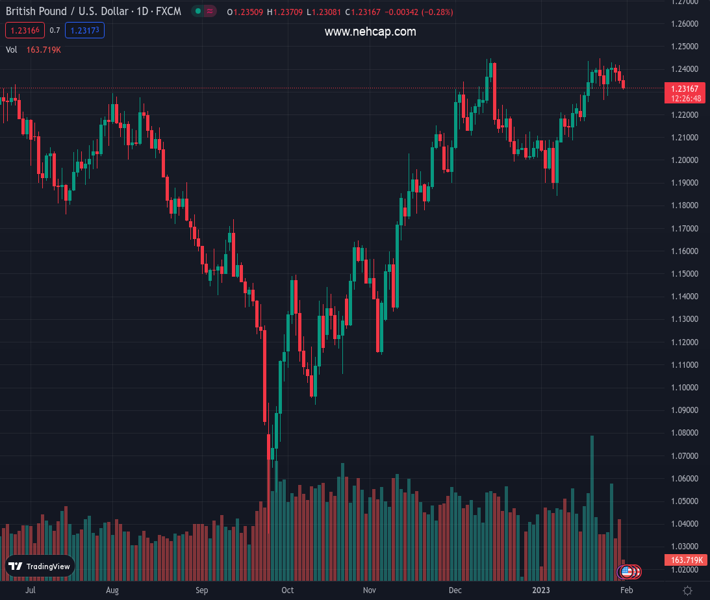
#GBPUSD @ 1.23168 turns lower for the third successive day amid notable USD demand. (Pivot Orderbook analysis)
…
This is a premium post.
[s2If !current_user_can(access_s2member_level4)]Please register for PREMIUM VERSION HERE to read full post below containing analysis. In case of any error or you think you are not able to read the full post below, please email us at support#nehcap.com [lwa][/s2If] [s2If current_user_can(access_s2member_level4)]
- GBP/USD turns lower for the third successive day amid notable USD demand.
- The prevalent cautious market mood is seen underpinning the safe-haven buck.
- Retreating US bond yields might cap the greenback and lend support to the pair.
- Traders also seem reluctant ahead of the FOMC and the BoE meetings this week.
The pair currently trades last at 1.23168.
The previous day high was 1.2418 while the previous day low was 1.2337. The daily 38.2% Fib levels comes at 1.2368, expected to provide resistance. Similarly, the daily 61.8% fib level is at 1.2387, expected to provide resistance.
The GBP/USD pair attracts fresh sellers following an early uptick to the 1.2370 area and turns negative for the third successive day on Tuesday. The downward trajectory drags spot prices to a four-day low during the first half of the European session, with bears now awaiting a break below the 1.2300 mark before placing fresh bets.
The US Dollar builds on the previous day’s positive move and climbs to a one-week high, which, in turn, is seen as a key factor exerting downward pressure on the GBP/USD pair. The uncertainty about a strong recovery in the Chinese economy – amid the worst yet COVID-19 outbreak in the country – continues to weigh on investors’ sentiment. This is evident from a generally weaker tone around the equity markets and drives some haven flows towards the greenback.
Apart from this, the USD further benefits from some repositioning trade ahead of the highly-anticipated FOMC decision, scheduled to be announced on Wednesday. The US central bank is expected to deliver a smaller 25 bps rate hike at the end of a two-day meeting. The recent US macro data, however, point to a resilient economy and backs the case for the Fed to stick to its hawkish stance for longer. This, in turn, prompts traders to lighten their bearish USD positions.
That said, a fresh leg down in the US Treasury bond yields might hold back the USD bulls from placing aggressive bets. Apart from this, speculations that elevated consumer inflation will force the Bank of England (BoE) to continue lifting rates might offer some support to the British Pound and limit losses for the GBP/USD pair. This, in turn, warrants some caution for aggressive bearish traders ahead of this week’s key central bank event risks – the FOMC on Wednesday and the BoE on Thursday.
In the meantime, traders on Tuesday might take cues from the US economic docket, featuring the release of the Chicago PMI and the Conference Board’s Consumer Confidence Index. This, along with the US bond yields and the broader market risk sentiment, might influence the USD price dynamics and provide some impetus to the GBP/USD pair.
Technical Levels: Supports and Resistances
GBPUSD currently trading at 1.2316 at the time of writing. Pair opened at 1.2349 and is trading with a change of -0.27 % .
| Overview | Overview.1 | |
|---|---|---|
| 0 | Today last price | 1.2316 |
| 1 | Today Daily Change | -0.0033 |
| 2 | Today Daily Change % | -0.2700 |
| 3 | Today daily open | 1.2349 |
The pair remains strongly bullish on the daily timeframe. It trades above its 20 SMA @ 1.2241, 50 SMA 1.2173, 100 SMA @ 1.1773 and 200 SMA @ 1.1961.
| Trends | Trends.1 | |
|---|---|---|
| 0 | Daily SMA20 | 1.2241 |
| 1 | Daily SMA50 | 1.2173 |
| 2 | Daily SMA100 | 1.1773 |
| 3 | Daily SMA200 | 1.1961 |
The previous day high was 1.2418 while the previous day low was 1.2337. The daily 38.2% Fib levels comes at 1.2368, expected to provide resistance. Similarly, the daily 61.8% fib level is at 1.2387, expected to provide resistance.
Note the levels of interest below:
- Pivot support is noted at 1.2318, 1.2287, 1.2238
- Pivot resistance is noted at 1.2398, 1.2448, 1.2479
| Levels | Levels.1 |
|---|---|
| Previous Daily High | 1.2418 |
| Previous Daily Low | 1.2337 |
| Previous Weekly High | 1.2448 |
| Previous Weekly Low | 1.2263 |
| Previous Monthly High | 1.2447 |
| Previous Monthly Low | 1.1992 |
| Daily Fibonacci 38.2% | 1.2368 |
| Daily Fibonacci 61.8% | 1.2387 |
| Daily Pivot Point S1 | 1.2318 |
| Daily Pivot Point S2 | 1.2287 |
| Daily Pivot Point S3 | 1.2238 |
| Daily Pivot Point R1 | 1.2398 |
| Daily Pivot Point R2 | 1.2448 |
| Daily Pivot Point R3 | 1.2479 |
[/s2If]
Join Our Telegram Group


