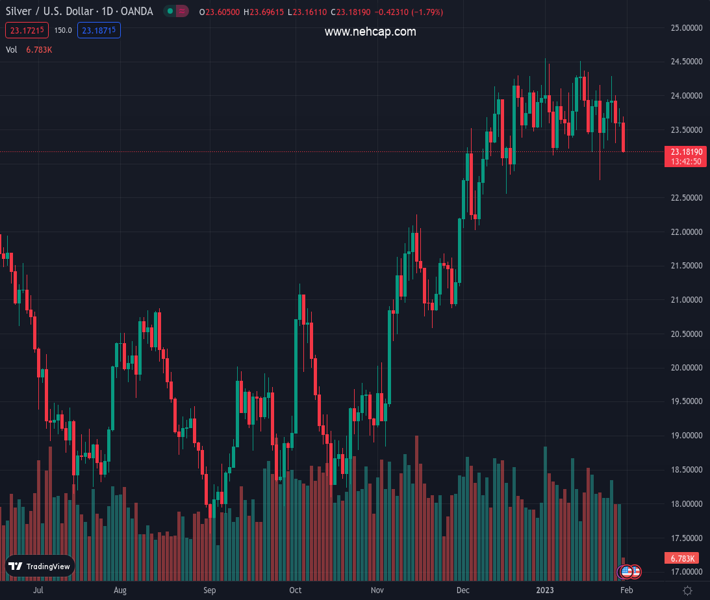
#XAGUSD @ 23.166 Silver meets with a fresh supply on Tuesday and seems vulnerable to sliding further. (Pivot Orderbook analysis)
…
This is a premium post.
[s2If !current_user_can(access_s2member_level4)]Please register for PREMIUM VERSION HERE to read full post below containing analysis. In case of any error or you think you are not able to read the full post below, please email us at support#nehcap.com [lwa][/s2If] [s2If current_user_can(access_s2member_level4)]
- Silver meets with a fresh supply on Tuesday and seems vulnerable to sliding further.
- Last week’s breakdown below the $23.80-$23.75 confluence favours bearish traders.
- A sustained move back above the $24.00 mark is needed to negate the negative bias.
The pair currently trades last at 23.166.
The previous day high was 23.81 while the previous day low was 23.54. The daily 38.2% Fib levels comes at 23.65, expected to provide resistance. Similarly, the daily 61.8% fib level is at 23.71, expected to provide resistance.
Silver comes under heavy selling pressure on Tuesday and slides back to the $23.30-$23.20 support zone during the early part of the European session. The technical setup, meanwhile, favours bearish traders and supports prospects for a further near-term depreciating move.
The XAG/USD last week confirmed a breakdown below the $23.70-$23.80 confluence support, comprising the 200-hour SMA and the lower end of a short-term ascending channel. The overnight failure near the said support breakpoint, now turned resistance, adds credence to the negative outlook. Moreover, oscillators on the daily chart have just started gaining negative traction.
Some follow-through selling below the $23.30-$23.20 area will reaffirm the bearish outlook and make the XAG/USD vulnerable to weaken further below the $23.00 mark. The next relevant support is pegged near the $22.75 area, below which the downward trajectory could get extended and drag the white metal towards the $22.20-$22.15 intermediate support en route to the $22.00 level.
Meanwhile, Relative Strength Index (RSI) on the 1-hour chart has moved on the verge of breaking into oversold territory. This makes it prudent to wait for some intraday consolidation or a modest rebound before positioning for additional losses. That said, any attempted recovery might now confront stiff resistance near the $23.60-$23.70 region, or the 100-hour SMA.
Any subsequent move up could attract fresh sellers and remain capped near the ascending trend-channel support breakpoint, currently around the $24.00 mark. The latter should act as a pivotal point, which if cleared decisively is likely to trigger a short-covering rally. The XAG/USD might then aim to retest the multi-month to, around the $24.50-$24.55 area touched in January.
Technical Levels: Supports and Resistances
XAGUSD currently trading at 23.31 at the time of writing. Pair opened at 23.57 and is trading with a change of -1.1 % .
| Overview | Overview.1 | |
|---|---|---|
| 0 | Today last price | 23.31 |
| 1 | Today Daily Change | -0.26 |
| 2 | Today Daily Change % | -1.10 |
| 3 | Today daily open | 23.57 |
The pair is trading below its 20 Daily moving average @ 23.75, above its 50 Daily moving average @ 23.26 , above its 100 Daily moving average @ 21.53 and above its 200 Daily moving average @ 21.01
| Trends | Trends.1 | |
|---|---|---|
| 0 | Daily SMA20 | 23.75 |
| 1 | Daily SMA50 | 23.26 |
| 2 | Daily SMA100 | 21.53 |
| 3 | Daily SMA200 | 21.01 |
The previous day high was 23.81 while the previous day low was 23.54. The daily 38.2% Fib levels comes at 23.65, expected to provide resistance. Similarly, the daily 61.8% fib level is at 23.71, expected to provide resistance.
Note the levels of interest below:
- Pivot support is noted at 23.48, 23.38, 23.21
- Pivot resistance is noted at 23.74, 23.91, 24.0
| Levels | Levels.1 |
|---|---|
| Previous Daily High | 23.81 |
| Previous Daily Low | 23.54 |
| Previous Weekly High | 24.30 |
| Previous Weekly Low | 22.76 |
| Previous Monthly High | 24.30 |
| Previous Monthly Low | 22.03 |
| Daily Fibonacci 38.2% | 23.65 |
| Daily Fibonacci 61.8% | 23.71 |
| Daily Pivot Point S1 | 23.48 |
| Daily Pivot Point S2 | 23.38 |
| Daily Pivot Point S3 | 23.21 |
| Daily Pivot Point R1 | 23.74 |
| Daily Pivot Point R2 | 23.91 |
| Daily Pivot Point R3 | 24.00 |
[/s2If]
Join Our Telegram Group
")


