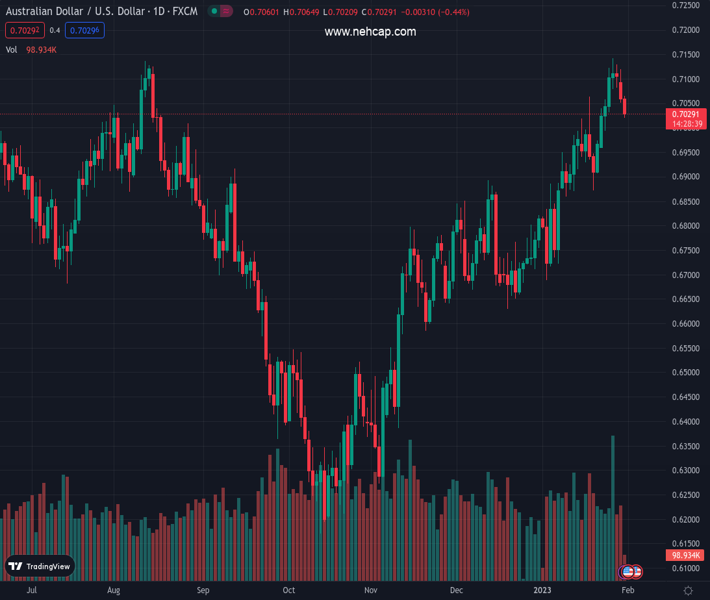
#AUDUSD @ 0.70287 drops to a one-week low on Tuesday and is pressured by a combination of factors. (Pivot Orderbook analysis)
…
This is a premium post.
[s2If !current_user_can(access_s2member_level4)]Please register for PREMIUM VERSION HERE to read full post below containing analysis. In case of any error or you think you are not able to read the full post below, please email us at support#nehcap.com [lwa][/s2If] [s2If current_user_can(access_s2member_level4)]
- AUD/USD drops to a one-week low on Tuesday and is pressured by a combination of factors.
- Disappointing Australian Retail Sales figures weigh on the Aussie amid a modest USD strength.
- Bets for smaller Fed rate hikes keep a lid on the buck and might help limit losses for the major.
The pair currently trades last at 0.70287.
The previous day high was 0.712 while the previous day low was 0.7051. The daily 38.2% Fib levels comes at 0.7078, expected to provide resistance. Similarly, the daily 61.8% fib level is at 0.7094, expected to provide resistance.
The AUD/USD pair remains under some selling pressure for the second straight day on Tuesday and extends its recent pullback from the highest level since June 2022 touched last week. The downward trajectory drags spot prices to a one-week low, below mid-0.7000s during the early European session and is sponsored by a combination of factors.
The Australian Dollar is weighed down by the disappointing domestic macro data, which showed that Retail Sales tumbled in December. Apart from this, a modest US dollar strength turns out to be another factor exerting some downward pressure on the AUD/USD pair. The prevalent cautious mood is seen driving some haven flows towards the greenback and undermining the risk-sensitive Aussie.
The market sentiment remains fragile in the wake of the uncertainty about a strong recovery in the Chinese economy, amid the worst yet COVID-19 outbreak in the country. This, to a larger extent, offsets the better-than-expected Chinese PMI prints for January and does little to impress traders or provide any immediate respite to the China-proxy Australian Dollar, at least for the time being.
The USD uptick, meanwhile, lacks bullish conviction amid rising bets for a smaller 25 bps Fed rate hike move at the end of a two-day policy meeting on Wednesday. This, along with the flight to safety, leads to a modest downtick in the US Treasury bond yields and acts as a headwind for the buck. This, in turn, warrants some caution before positioning for any further downfall for the AUD/USD pair.
Traders might also prefer to move to the sidelines ahead of the critical FOMC monetary policy decision on Wednesday. In the meantime, Tuesday’s US economic docket, featuring Chicago PMI and the Conference Board’s Consumer Confidence Index, will be looked upon for some impetus. This, along with the broader risk sentiment, could drive the USD and produce short-term opportunities around the AUD/USD pair.
Technical Levels: Supports and Resistances
AUDUSD currently trading at 0.7024 at the time of writing. Pair opened at 0.7058 and is trading with a change of -0.48 % .
| Overview | Overview.1 | |
|---|---|---|
| 0 | Today last price | 0.7024 |
| 1 | Today Daily Change | -0.0034 |
| 2 | Today Daily Change % | -0.4800 |
| 3 | Today daily open | 0.7058 |
The pair remains strongly bullish on the daily timeframe. It trades above its 20 SMA @ 0.6954, 50 SMA 0.6825, 100 SMA @ 0.6657 and 200 SMA @ 0.6812.
| Trends | Trends.1 | |
|---|---|---|
| 0 | Daily SMA20 | 0.6954 |
| 1 | Daily SMA50 | 0.6825 |
| 2 | Daily SMA100 | 0.6657 |
| 3 | Daily SMA200 | 0.6812 |
The previous day high was 0.712 while the previous day low was 0.7051. The daily 38.2% Fib levels comes at 0.7078, expected to provide resistance. Similarly, the daily 61.8% fib level is at 0.7094, expected to provide resistance.
Note the levels of interest below:
- Pivot support is noted at 0.7033, 0.7007, 0.6964
- Pivot resistance is noted at 0.7102, 0.7146, 0.7171
| Levels | Levels.1 |
|---|---|
| Previous Daily High | 0.7120 |
| Previous Daily Low | 0.7051 |
| Previous Weekly High | 0.7143 |
| Previous Weekly Low | 0.6960 |
| Previous Monthly High | 0.6893 |
| Previous Monthly Low | 0.6629 |
| Daily Fibonacci 38.2% | 0.7078 |
| Daily Fibonacci 61.8% | 0.7094 |
| Daily Pivot Point S1 | 0.7033 |
| Daily Pivot Point S2 | 0.7007 |
| Daily Pivot Point S3 | 0.6964 |
| Daily Pivot Point R1 | 0.7102 |
| Daily Pivot Point R2 | 0.7146 |
| Daily Pivot Point R3 | 0.7171 |
[/s2If]
Join Our Telegram Group
")


