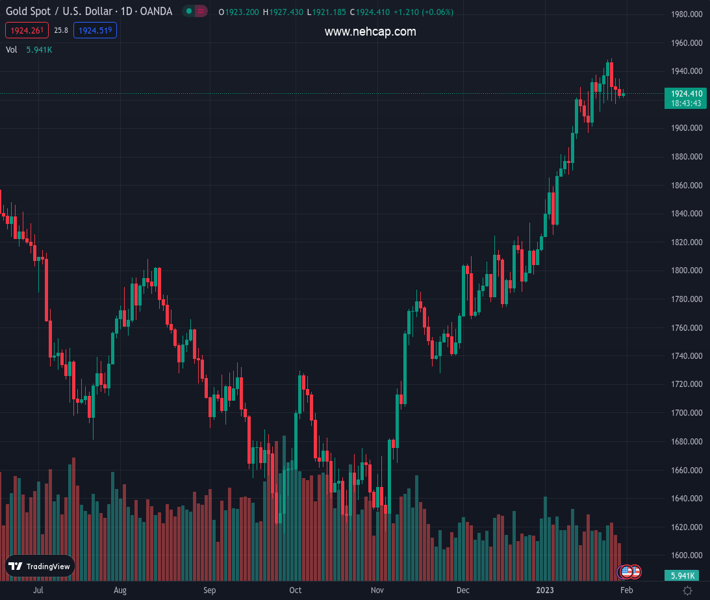
#XAUUSD @ 1,924.57 Gold price prints the first daily gains in four while reversing from monthly support line., @nehcap view: Limited recovery expected (Pivot Orderbook analysis)
…
This is a premium post.
[s2If !current_user_can(access_s2member_level4)]Please register for PREMIUM VERSION HERE to read full post below containing analysis. In case of any error or you think you are not able to read the full post below, please email us at support#nehcap.com [lwa][/s2If] [s2If current_user_can(access_s2member_level4)]
- Gold price prints the first daily gains in four while reversing from monthly support line.
- Market sentiment improves on upbeat China Purchasing Managers’ Indexes, International Monetary Fund growth forecasts.
- Anxiety ahead of Federal Reserve monetary policy, key earnings probe XAU/USD run-up.
- United States CB Consumer Confidence for January, Employment Cost Index for Q4 eyed for intraday directions.
The pair currently trades last at 1924.57.
The previous day high was 1934.54 while the previous day low was 1920.67. The daily 38.2% Fib levels comes at 1925.97, expected to provide resistance. Similarly, the daily 61.8% fib level is at 1929.24, expected to provide resistance.
Gold price (XAU/USD) licks its wounds around $1,925 after a three-day downtrend as market sentiment improves during early Tuesday. The reason could be linked to China’s official activity data and the upbeat growth forecasts from the International Monetary Fund (IMF). Adding strength to the optimism are the Covid headlines. However, the anxiety ahead of top-tier central bank meetings and the key earnings report probe the Gold buyers of late.
A cautious mood ahead of this week’s bumper data joined the upbeat United States Dallas Fed manufacturing index for January, which marked the highest reading since May 2022, to favor the Gold bears the previous day. However, risk-positive headlines surrounding the Coronavirus-led restrictions from China and the US seemed to have probed the XAU/USD sellers afterward.
News suggesting US President Joe Biden’s administration’s readiness to revoke the Covid-led emergencies from May 11 appeared to have favored the risk-on profile of late. On Monday, China’s Center for Disease Control and Prevention (CDC) said, reported by Reuters, “China’s current wave of COVID-19 infections is nearing an end, and there was no significant rebound in cases during the Lunar New Year holiday.”
Having heard the positive updates over the Covid-linked restrictions, the upbeat prints of China’s NBS Purchasing Managers’ Indexes (PMI) for January added strength to the Gold price recovery. That said, China’s NBS Manufacturing PMI rose to 50.1 versus 49.7 market forecasts and 47.0 prior whereas Non-Manufacturing PMI also came in upbeat with 54.4 figure compared to 51.0 expected and 41.6 previous readings.
The International Monetary Fund (IMF) recently raised its global growth estimates while saying that the emerging markets’ growth slowdown bottomed out in 2022. The global lender also stated that estimates come with the backdrop of a slight increase in the 2023 global growth outlook helped by “surprisingly resilient” demand in the United States and Europe, an easing of energy costs and the reopening of China’s economy after Beijing abandoned its strict COVID-19 restrictions.
In addition to the aforementioned risk-positive catalysts, the lack of hawkish concerns in the market also weighs on the United States Treasury bond yields and the US Dollar, which in turn probe the Gold sellers. That said, the US 10-year Treasury yields struggle to extend a three-day uptrend near 3.54% while the US Dollar Index (DXY) retreats to 102.20 at the latest.
That said, the US fourth-quarter (Q4) Employment Cost Index (ECI) and the Conference Board’s Consumer Confidence gauge for January will be eyed for immediate directions. As per the market consensus, the US Consumer sentiment gauge may improve but a likely softer print of the US ECI, to 1.1% from 1.2%, could strengthen the dovish bias surrounding Fed and can recall the XAU/USD buyers.
It should, however, be noted that the cautious mood ahead of the earnings reports from the equity heavyweights like Amazon, Alphabet, Apple and Meta also could challenge the market’s optimism and the Gold price.
Gold price recovers from a one-month-old ascending support line while teasing the XAU/USD buyers amid the mostly steady Relative Strength Index (RSI).
However, a clear downside break of the 50-bar Simple Moving Average (SMA) joins the bearish signals from the Moving Average Convergence and Divergence (MACD) indicator to keep the Gold sellers hopeful.
As a result, the metal’s rebound remains elusive unless it remains below the 50-SMA, around $1,930 by the press time.
Following that, multiple swing highs marked since Thursday could probe the Gold buyers around $1,935 before highlighting the monthly peak of $1,949 and the $1,950 round figure.
It’s worth noting, however, that an upward-sloping resistance line from January 16, close to $1,958 by the press time, appears the last defense for the XAU/USD bears.
Alternatively, a downside break of the aforementioned support line, close to $1,920, could trigger a quick fall of the Gold price towards the $1,900 threshold.
However, the metal’s sustained weakness past $1,900 will make it vulnerable to testing the 200-SMA, near $1,863 at the latest.
Trend: Limited recovery expected
Technical Levels: Supports and Resistances
XAUUSD currently trading at 1925.57 at the time of writing. Pair opened at 1922.14 and is trading with a change of 0.18% % .
| Overview | Overview.1 | |
|---|---|---|
| 0 | Today last price | 1925.57 |
| 1 | Today Daily Change | 3.43 |
| 2 | Today Daily Change % | 0.18% |
| 3 | Today daily open | 1922.14 |
The pair remains strongly bullish on the daily timeframe. It trades above its 20 SMA @ 1901.06, 50 SMA 1832.91, 100 SMA @ 1757.26 and 200 SMA @ 1775.6.
| Trends | Trends.1 | |
|---|---|---|
| 0 | Daily SMA20 | 1901.06 |
| 1 | Daily SMA50 | 1832.91 |
| 2 | Daily SMA100 | 1757.26 |
| 3 | Daily SMA200 | 1775.60 |
The previous day high was 1934.54 while the previous day low was 1920.67. The daily 38.2% Fib levels comes at 1925.97, expected to provide resistance. Similarly, the daily 61.8% fib level is at 1929.24, expected to provide resistance.
Note the levels of interest below:
- Pivot support is noted at 1917.03, 1911.91, 1903.16
- Pivot resistance is noted at 1930.9, 1939.65, 1944.77
| Levels | Levels.1 |
|---|---|
| Previous Daily High | 1934.54 |
| Previous Daily Low | 1920.67 |
| Previous Weekly High | 1949.27 |
| Previous Weekly Low | 1911.45 |
| Previous Monthly High | 1833.38 |
| Previous Monthly Low | 1765.89 |
| Daily Fibonacci 38.2% | 1925.97 |
| Daily Fibonacci 61.8% | 1929.24 |
| Daily Pivot Point S1 | 1917.03 |
| Daily Pivot Point S2 | 1911.91 |
| Daily Pivot Point S3 | 1903.16 |
| Daily Pivot Point R1 | 1930.90 |
| Daily Pivot Point R2 | 1939.65 |
| Daily Pivot Point R3 | 1944.77 |
[/s2If]
Join Our Telegram Group
")


