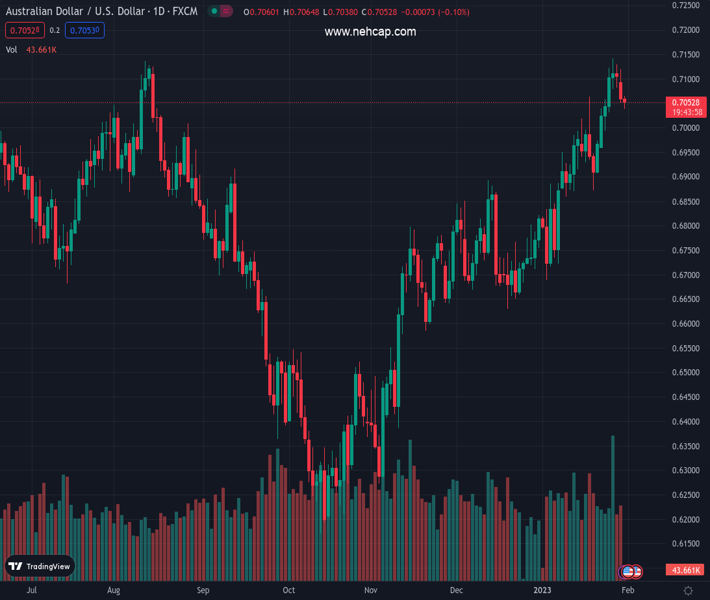
#AUDUSD @ 0.70532 picks up bids to challenge two-day downtrend. (Pivot Orderbook analysis)
…
This is a premium post.
[s2If !current_user_can(access_s2member_level4)]Please register for PREMIUM VERSION HERE to read full post below containing analysis. In case of any error or you think you are not able to read the full post below, please email us at support#nehcap.com [lwa][/s2If] [s2If current_user_can(access_s2member_level4)]
- AUD/USD picks up bids to challenge two-day downtrend.
- China official PMIs came in firmer for January, IMF revised up growth forecasts.
- Aussie Retail Sales, cautious mood ahead of the key data/events previously weighed on prices.
- US data eyed ahead of Fed meeting, risk catalysts are important too.
The pair currently trades last at 0.70532.
The previous day high was 92.66 while the previous day low was 91.61. The daily 38.2% Fib levels comes at 92.01, expected to provide resistance. Similarly, the daily 61.8% fib level is at 92.26, expected to provide resistance.
AUD/USD probes the two-day downtrend while picking up bids from the intraday low amid the risk-positive headlines from China and the International Monetary Fund (IMF). Even so, the buyers seem to struggle in retaking control amid anxiety ahead of this week’s top-tier central bank meeting. That said, the Aussie pair makes rounds to 0.7055 during early Tuesday, following the recent bounce off intraday low of 0.7038.
The IMF recently raised its global growth estimates while saying that the emerging markets’ growth slowdown bottomed out in 2022. The global lender also stated that estimates come with the backdrop of a slight increase in the 2023 global growth outlook helped by “surprisingly resilient” demand in the United States and Europe, an easing of energy costs and the reopening of China’s economy after Beijing abandoned its strict COVID-19 restrictions.
Before that, China’s NBS Manufacturing PMI rose to 50.1 versus 49.7 market forecasts and 47.0 prior whereas Non-Manufacturing PMI also came in upbeat with 54.4 figure compared to 51.0 expected and 41.6 previous readings.
Adding to the cautious optimism could be the news suggesting US President Joe Biden’s administration’s readiness to revoke the Covid-led emergencies from May 11 appeared to have favored the risk-on profile of late. On Monday, China’s Center for Disease Control and Prevention (CDC) said, reported by Reuters, “China’s current wave of COVID-19 infections is nearing an end, and there was no significant rebound in cases during the Lunar New Year holiday.”
It should be noted that downbeat Aussie Retail Sales for December joined the cautious mood ahead of the Federal Open Market Committee (FOMC) monetary policy meeting to weigh on the AUD/USD prices earlier in the day. It’s worth noting that Aussie Retail Sales marked a contraction figure of 3.9% for December versus -0.3% number expected and 1.4% prior.
While portraying the mood, the S&P 500 Futures print mild gains despite downbeat Wall Street performance whereas the US 10-year Treasury yields retreat to 3.54% after posting a three-day winning streak in the last.
Looking ahead, the US fourth-quarter (Q4) Employment Cost Index (ECI) and the Conference Board’s Consumer Confidence gauge for January will be eyed for immediate directions. As per the market consensus, the US Consumer sentiment gauge may improve but a likely softer print of the US ECI, to 1.1% from 1.2%, could strengthen the dovish bias surrounding Fed and can recall the AUD/USD buyers.
A one-month-old bullish channel’s lower line restricts AUD/USD pair’s downside near the 0.7000 round figure.
Technical Levels: Supports and Resistances
AUDUSD currently trading at 91.83 at the time of writing. Pair opened at 92.09 and is trading with a change of -0.28% % .
| Overview | Overview.1 | |
|---|---|---|
| 0 | Today last price | 91.83 |
| 1 | Today Daily Change | -0.26 |
| 2 | Today Daily Change % | -0.28% |
| 3 | Today daily open | 92.09 |
The pair is trading above its 20 Daily moving average @ 90.65, above its 50 Daily moving average @ 91.15 , below its 100 Daily moving average @ 92.63 and below its 200 Daily moving average @ 93.04
| Trends | Trends.1 | |
|---|---|---|
| 0 | Daily SMA20 | 90.65 |
| 1 | Daily SMA50 | 91.15 |
| 2 | Daily SMA100 | 92.63 |
| 3 | Daily SMA200 | 93.04 |
The previous day high was 92.66 while the previous day low was 91.61. The daily 38.2% Fib levels comes at 92.01, expected to provide resistance. Similarly, the daily 61.8% fib level is at 92.26, expected to provide resistance.
Note the levels of interest below:
- Pivot support is noted at 91.58, 91.07, 90.54
- Pivot resistance is noted at 92.63, 93.17, 93.67
| Levels | Levels.1 |
|---|---|
| Previous Daily High | 92.66 |
| Previous Daily Low | 91.61 |
| Previous Weekly High | 92.82 |
| Previous Weekly Low | 90.17 |
| Previous Monthly High | 93.81 |
| Previous Monthly Low | 87.02 |
| Daily Fibonacci 38.2% | 92.01 |
| Daily Fibonacci 61.8% | 92.26 |
| Daily Pivot Point S1 | 91.58 |
| Daily Pivot Point S2 | 91.07 |
| Daily Pivot Point S3 | 90.54 |
| Daily Pivot Point R1 | 92.63 |
| Daily Pivot Point R2 | 93.17 |
| Daily Pivot Point R3 | 93.67 |
[/s2If]
Join Our Telegram Group
")


