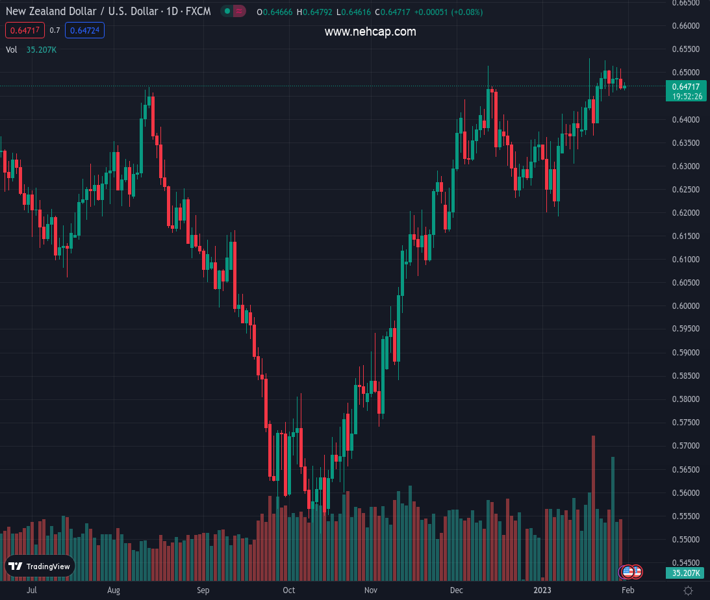
#NZDUSD @ 0.64727 fails to extend the week-start bearish bias, staying pressured around intraday low. (Pivot Orderbook analysis)
…
This is a premium post.
[s2If !current_user_can(access_s2member_level4)]Please register for PREMIUM VERSION HERE to read full post below containing analysis. In case of any error or you think you are not able to read the full post below, please email us at support#nehcap.com [lwa][/s2If] [s2If current_user_can(access_s2member_level4)]
- NZD/USD fails to extend the week-start bearish bias, staying pressured around intraday low.
- China’s officials NBS Manufacturing PMI, Non-Manufacturing PMI arrived stronger in January.
- Markets sentiment remains divided ahead of the top-tier data in the West.
- US CB Consumer Confidence may entertain Kiwi pair traders ahead of the key FOMC.
The pair currently trades last at 0.64727.
The previous day high was 0.6509 while the previous day low was 0.6461. The daily 38.2% Fib levels comes at 0.6479, expected to provide resistance. Similarly, the daily 61.8% fib level is at 0.6491, expected to provide resistance.
NZD/USD probes the week-start losses, making rounds to 0.6465-70 by the press time, as upbeat activity data from China contrast with the previous bearish bias surrounding the Kiwi pair during early Tuesday.
That said, China’s NBS Manufacturing PMI rose to 50.1 versus 49.7 market forecasts and 47.0 prior whereas Non-Manufacturing PMI also came in upbeat with 54.4 figure compared to 51.0 expected and 41.6 previous readings.
It should be observed that the market’s cautious mood ahead of this week’s central bank announcements exerts downside pressure on the Kiwi pair. Not only the pre-data anxiety but mixed concerns surrounding China also probe the market sentiment and the NZD/USD pair traders.
On the other hand, upbeat Covid-linked headlines surrounding China and the US probe the quote’s bearish move. That said, news suggesting US President Joe Biden’s administration’s readiness to revoke the Covid-led emergencies from May 11 appeared to have favored the risk-on profile of late. On Monday, China’s Center for Disease Control and Prevention (CDC) said, reported by Reuters, “China’s current wave of COVID-19 infections is nearing an end, and there was no significant rebound in cases during the Lunar New Year holiday.”
Amid these plays, the S&P 500 Futures print mild gains despite downbeat Wall Street performance whereas the US 10-year Treasury yields remain unchanged at around 3.55% after posting a three-day winning streak in the last.
Having reacted to China’s key activity data, the NZD/USD pair traders may pay close attention to the risk catalysts ahead of the fourth-quarter (Q4) US Employment Cost Index (ECI) and the Conference Board’s Consumer Confidence gauge for January for clear directions. It should be noted that the US Consumer sentiment gauge to improve but a likely softer print of the US ECI, to 1.1% from 1.2% could strengthen the dovish bias surrounding the Fed and probe the Kiwi pair bears. However, major attention will be given to Wednesday’s New Zealand Q4 employment data and the Federal Open Market Committee (FOMC) monetary policy meeting.
Unless providing a daily closing beyond the three-week-old support line, currently around 0.6520, the NZD/USD price is likely declining towards the 21-DMA level of 0.6405.
Technical Levels: Supports and Resistances
NZDUSD currently trading at 0.6469 at the time of writing. Pair opened at 0.6469 and is trading with a change of -0.00% % .
| Overview | Overview.1 | |
|---|---|---|
| 0 | Today last price | 0.6469 |
| 1 | Today Daily Change | 0.0000 |
| 2 | Today Daily Change % | -0.00% |
| 3 | Today daily open | 0.6469 |
The pair remains strongly bullish on the daily timeframe. It trades above its 20 SMA @ 0.6402, 50 SMA 0.6353, 100 SMA @ 0.6088 and 200 SMA @ 0.6193.
| Trends | Trends.1 | |
|---|---|---|
| 0 | Daily SMA20 | 0.6402 |
| 1 | Daily SMA50 | 0.6353 |
| 2 | Daily SMA100 | 0.6088 |
| 3 | Daily SMA200 | 0.6193 |
The previous day high was 0.6509 while the previous day low was 0.6461. The daily 38.2% Fib levels comes at 0.6479, expected to provide resistance. Similarly, the daily 61.8% fib level is at 0.6491, expected to provide resistance.
Note the levels of interest below:
- Pivot support is noted at 0.645, 0.6432, 0.6402
- Pivot resistance is noted at 0.6498, 0.6528, 0.6546
| Levels | Levels.1 |
|---|---|
| Previous Daily High | 0.6509 |
| Previous Daily Low | 0.6461 |
| Previous Weekly High | 0.6526 |
| Previous Weekly Low | 0.6437 |
| Previous Monthly High | 0.6514 |
| Previous Monthly Low | 0.6230 |
| Daily Fibonacci 38.2% | 0.6479 |
| Daily Fibonacci 61.8% | 0.6491 |
| Daily Pivot Point S1 | 0.6450 |
| Daily Pivot Point S2 | 0.6432 |
| Daily Pivot Point S3 | 0.6402 |
| Daily Pivot Point R1 | 0.6498 |
| Daily Pivot Point R2 | 0.6528 |
| Daily Pivot Point R3 | 0.6546 |
[/s2If]
Join Our Telegram Group
")


