#USDCNH @ 6.75612 is showing wild ticks on better-than-projected China’s official PMI data. (Pivot Orderbook analysis)
…
This is a premium post.
[s2If !current_user_can(access_s2member_level4)]Please register for PREMIUM VERSION HERE to read full post below containing analysis. In case of any error or you think you are not able to read the full post below, please email us at support#nehcap.com [lwa][/s2If] [s2If current_user_can(access_s2member_level4)]
- USD/CNH is showing wild ticks on better-than-projected China’s official PMI data.
- Official Manufacturing PMI has soared to 50.1 while the Non-Manufacturing PMI has climbed to 54.4.
- The risk-perceived assets are failing to find a cushion amid Fed policy inspired-volatility.
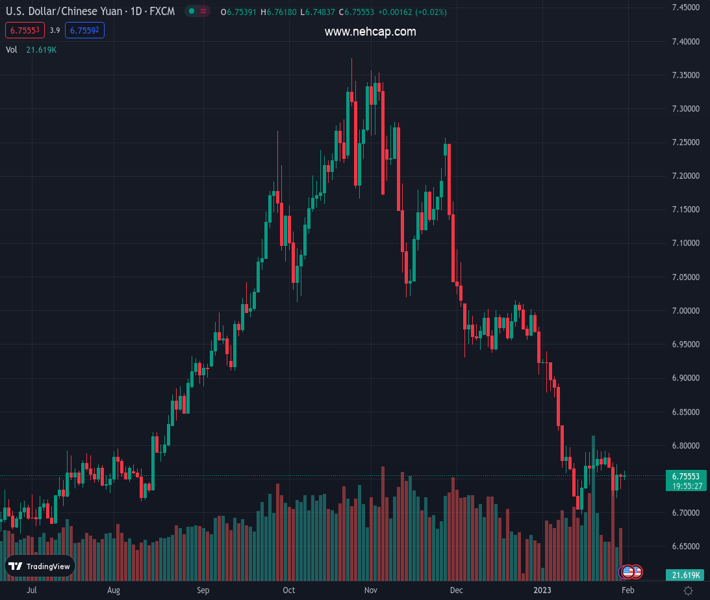
The pair currently trades last at 6.75612.
The previous day high was 6.7638 while the previous day low was 6.739. The daily 38.2% Fib levels comes at 6.7485, expected to provide support. Similarly, the daily 61.8% fib level is at 6.7544, expected to provide support.
The USD/CNH pair is displaying wild gyrations as China’s National Bureau of Statistics (NBS) has reported upbeat official PMI data. The Official Manufacturing PMI has landed at 50.1, higher than the consensus of 49.7 and the prior release of 49.0. Also, the Non-Manufacturing PMI has soared to 54.4 from the projections of 51.0 and the prior release of 41.6. The scale of economic activities in the Chinese economy improved significantly in January despite the households being busy celebrating the Lunar New Year festival.
However, the major catalyst that will trigger a power-pack action in the Chinese Yuan will be the Caixin Manufacturing PMI data, which will release on Wednesday. The economic data might advance to 49.5 from the prior release of 49.0.
Firms in the Chinese economy are operating at maximum capacity as the administration has removed restrictions over the movement of men, materials, and machines. A Reuters poll showed that China’s economic growth is likely to rebound to 4.9% in 2023, before steadying in 2024, as policymakers pledge to step up support for the COVID-ravaged economy. Also, the poll showed that the People’s Bank of China will cut Loan Prime Rate (LPR) by 5 basis points (bps) in the first quarter of CY2023.
Meanwhile, the risk-off impulse is regaining traction as the S&P500 futures have surrendered more than half gains generated in early Asia. The risk-perceived assets are likely to remain on the tenterhooks as the Federal Reserve (Fed) is set to hike interest rates further to achieve the 2% inflation target. Fed chair Jerome Powell is expected to announce a 25 basis point (bps) interest rate hike as the consumer spending and Producer Price Index (PPI) have significantly dropped in the United States economy.
Technical Levels: Supports and Resistances
USDCNH currently trading at 6.7588 at the time of writing. Pair opened at 6.758 and is trading with a change of 0.01 % .
| Overview | Overview.1 | |
|---|---|---|
| 0 | Today last price | 6.7588 |
| 1 | Today Daily Change | 0.0008 |
| 2 | Today Daily Change % | 0.0100 |
| 3 | Today daily open | 6.7580 |
The pair remains strongly bearish on the daily time frame. It trades below the 20 SMA @ 6.787, 50 SMA 6.9276, 100 SMA @ 7.0443 and 200 SMA @ 6.899.
| Trends | Trends.1 | |
|---|---|---|
| 0 | Daily SMA20 | 6.7870 |
| 1 | Daily SMA50 | 6.9276 |
| 2 | Daily SMA100 | 7.0443 |
| 3 | Daily SMA200 | 6.8990 |
The previous day high was 6.7638 while the previous day low was 6.739. The daily 38.2% Fib levels comes at 6.7485, expected to provide support. Similarly, the daily 61.8% fib level is at 6.7544, expected to provide support.
Note the levels of interest below:
- Pivot support is noted at 6.7435, 6.7288, 6.7187
- Pivot resistance is noted at 6.7683, 6.7784, 6.7931
| Levels | Levels.1 |
|---|---|
| Previous Daily High | 6.7638 |
| Previous Daily Low | 6.7390 |
| Previous Weekly High | 6.7916 |
| Previous Weekly Low | 6.7218 |
| Previous Monthly High | 7.0914 |
| Previous Monthly Low | 6.9050 |
| Daily Fibonacci 38.2% | 6.7485 |
| Daily Fibonacci 61.8% | 6.7544 |
| Daily Pivot Point S1 | 6.7435 |
| Daily Pivot Point S2 | 6.7288 |
| Daily Pivot Point S3 | 6.7187 |
| Daily Pivot Point R1 | 6.7683 |
| Daily Pivot Point R2 | 6.7784 |
| Daily Pivot Point R3 | 6.7931 |
[/s2If]
Join Our Telegram Group
")


