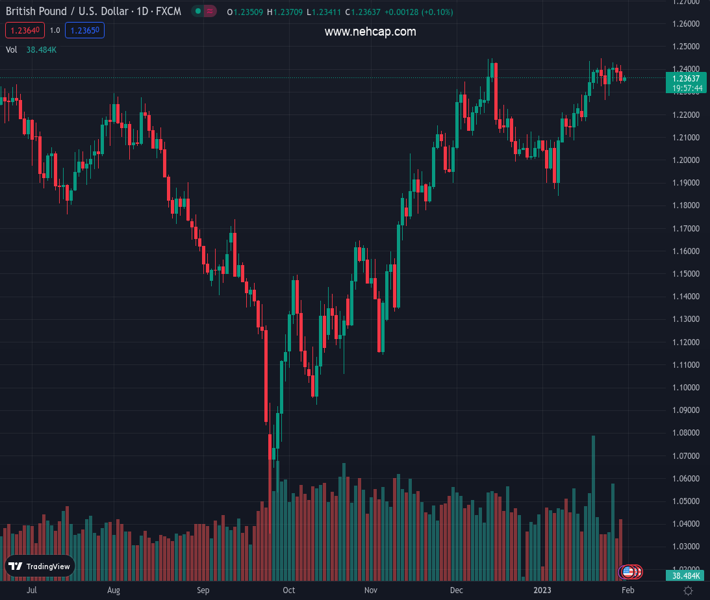
#GBPUSD @ 1.23659 The Cable has found a cushion as the USD Index has extended its correction. (Pivot Orderbook analysis)
…
This is a premium post.
[s2If !current_user_can(access_s2member_level4)]Please register for PREMIUM VERSION HERE to read full post below containing analysis. In case of any error or you think you are not able to read the full post below, please email us at support#nehcap.com [lwa][/s2If] [s2If current_user_can(access_s2member_level4)]
- The Cable has found a cushion as the USD Index has extended its correction.
- Pound Sterling bulls have found support from the 200-EMA around 1.2350.
- A breakdown of the RSI (14) into the 20.00-40.00 range will trigger the bearish momentum.
The pair currently trades last at 1.23659.
The previous day high was 1.2418 while the previous day low was 1.2337. The daily 38.2% Fib levels comes at 1.2368, expected to provide resistance. Similarly, the daily 61.8% fib level is at 1.2387, expected to provide resistance.
The GBP/USD pair has sensed a buying interest after dropping below 1.2340 in the Asian session. On Monday, the Cable witnessed selling pressure after failing to sustain above the round-level resistance of 1.2400. The major has shown a rebound amid a correction in the US Dollar Index (DXY) below 101.80, however, the downside bias for Cable is still solid amid overall pessimism in the market.
S&P500 futures have surrendered half of their gains recorded in early Asia, which indicates that the risk appetite of the market participants is declining again. Meanwhile, the 10-year year US Treasury yields are still holding above 3.54% despite a minor correction.
GBP/USD has picked significant bids after dropping to near the horizontal support of the Descending Triangle chart pattern plotted from January 26 low at 1.2344 on an hourly scale. The downward-sloping trendline of the aforementioned chart pattern is placed from January 26 high at 1.2430. On Monday, the Cable attempted to deliver a breakout of Descending Triangle, however, the lack of follow-up buying failed to maintain momentum in the Pound Sterling.
The asset is oscillating below the 50-period Exponential Moving Average (EMA) at 1.2375, which indicates that the short-term trend is bearish now.
On the contrary, the 200-EMA at 1.2350 has acted as a cushion for the Pound Sterling bulls.
The Relative Strength Index (RSI) (14) has yet not surrendered the 40.00-60.00 range. A breakdown into the 20.00-40.00 range will trigger the downside momentum.
Should the Cable break above the seven-month high of 1.2448 decisively, Pound Sterling bulls will drive the asset towards the psychological resistance of 1.2500 and June 7 high around 1.2600.
The Cable will display a sheer downside if it drops below Monday’s low at 1.2171 as it will drag the major toward January 11 low at 1.2100 followed by the psychological support at 1.2000.
Technical Levels: Supports and Resistances
GBPUSD currently trading at 1.2366 at the time of writing. Pair opened at 1.2349 and is trading with a change of 0.14 % .
| Overview | Overview.1 | |
|---|---|---|
| 0 | Today last price | 1.2366 |
| 1 | Today Daily Change | 0.0017 |
| 2 | Today Daily Change % | 0.1400 |
| 3 | Today daily open | 1.2349 |
The pair remains strongly bullish on the daily timeframe. It trades above its 20 SMA @ 1.2241, 50 SMA 1.2173, 100 SMA @ 1.1773 and 200 SMA @ 1.1961.
| Trends | Trends.1 | |
|---|---|---|
| 0 | Daily SMA20 | 1.2241 |
| 1 | Daily SMA50 | 1.2173 |
| 2 | Daily SMA100 | 1.1773 |
| 3 | Daily SMA200 | 1.1961 |
The previous day high was 1.2418 while the previous day low was 1.2337. The daily 38.2% Fib levels comes at 1.2368, expected to provide resistance. Similarly, the daily 61.8% fib level is at 1.2387, expected to provide resistance.
Note the levels of interest below:
- Pivot support is noted at 1.2318, 1.2287, 1.2238
- Pivot resistance is noted at 1.2398, 1.2448, 1.2479
| Levels | Levels.1 |
|---|---|
| Previous Daily High | 1.2418 |
| Previous Daily Low | 1.2337 |
| Previous Weekly High | 1.2448 |
| Previous Weekly Low | 1.2263 |
| Previous Monthly High | 1.2447 |
| Previous Monthly Low | 1.1992 |
| Daily Fibonacci 38.2% | 1.2368 |
| Daily Fibonacci 61.8% | 1.2387 |
| Daily Pivot Point S1 | 1.2318 |
| Daily Pivot Point S2 | 1.2287 |
| Daily Pivot Point S3 | 1.2238 |
| Daily Pivot Point R1 | 1.2398 |
| Daily Pivot Point R2 | 1.2448 |
| Daily Pivot Point R3 | 1.2479 |
[/s2If]
Join Our Telegram Group
")


