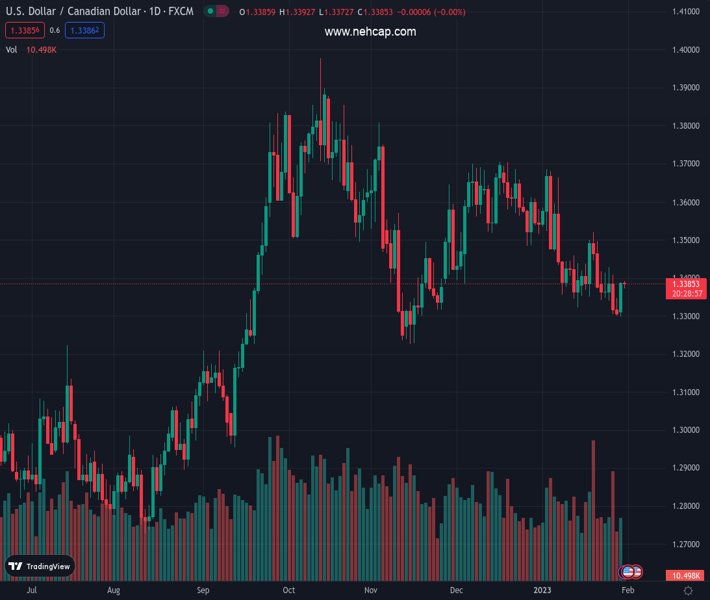
#USDCAD @ 1.33838 retreats from intraday high, consolidates the biggest daily gains in a fortnight. (Pivot Orderbook analysis)
…
This is a premium post.
[s2If !current_user_can(access_s2member_level4)]Please register for PREMIUM VERSION HERE to read full post below containing analysis. In case of any error or you think you are not able to read the full post below, please email us at support#nehcap.com [lwa][/s2If] [s2If current_user_can(access_s2member_level4)]
- USD/CAD retreats from intraday high, consolidates the biggest daily gains in a fortnight.
- Covid-linked headlines put a floor under the Oil price after it dropped amid risk-aversion, fears of more supplies.
- Market sentiment remains divided ahead of the key data/events.
- Canada GDP for November, US CB Consumer Confidence can entertain traders ahead of FOMC.
The pair currently trades last at 1.33838.
The previous day high was 1.3389 while the previous day low was 1.33. The daily 38.2% Fib levels comes at 1.3355, expected to provide support. Similarly, the daily 61.8% fib level is at 1.3334, expected to provide support.
USD/CAD runs out of ammunition to extend the previous day’s rebound amid sluggish markets on early Tuesday. In doing so, the Loonie pair justifies the pause in the Oil price downturn, as well as the halt in the risk-aversion wave, ahead of Canada’s monthly Gross Domestic Product (GDP) data.
That said, WTI crude oil pauses the two-day downtrend near $78.00 as hopes of an end to the Covid woes renew energy demand hopes. Earlier in the data, the news suggesting US President Joe Biden’s administration’s readiness to revoke the Covid-led emergencies appeared to have favored the sentiment of late. On Monday, China’s Center for Disease Control and Prevention (CDC) said, reported by Reuters, “China’s current wave of COVID-19 infections is nearing an end, and there was no significant rebound in cases during the Lunar New Year holiday.”
Elsewhere, headlines from Chinese media signaling the state banks’ cheap loans to spur consumption in Beijing also underpin the cautious optimism.
However, the anxiety ahead of this week’s top-tier central bank events and the US jobs report, not to forget China’s return from one-week-long Lunar New year (LNY) holidays, seems to challenge the risk-on mood and keep the USD/CAD buyers hopeful.
Additionally, Monday’s upbeat prints of the US Dallas Fed manufacturing index for January, which jumped to -8.4 while adding 11.6 points and marking the highest reading since May 2022, also underpin the bullish bias surrounding the USD/CAD pair.
Against this backdrop, the S&P 500 Futures print mild gains despite downbeat Wall Street performance whereas the US 10-year Treasury yields remain unchanged at around 3.55% after posting a three-day winning streak in the last.
Looking forward, Canadian GDP for November, expected 0.0% versus 0.1% prior may offer immediate directions to the Loonie pair ahead of the fourth quarter (Q4) US Employment Cost Index (ECI) and the Conference Board’s Consumer Confidence gauge for January for clear directions. That said, forecasts suggest the US Consumer sentiment gauge to improve but a likely softer print of the US ECI, to 1.1% from 1.2% could strengthen the dovish bias surrounding the Fed and tease the USD/CAD bears.
The monthly falling wedge bullish chart pattern, currently between 1.3410 and 1.3290, keeps the USD/CAD buyers hopeful.
Technical Levels: Supports and Resistances
USDCAD currently trading at 1.3384 at the time of writing. Pair opened at 1.3389 and is trading with a change of -0.04% % .
| Overview | Overview.1 | |
|---|---|---|
| 0 | Today last price | 1.3384 |
| 1 | Today Daily Change | -0.0005 |
| 2 | Today Daily Change % | -0.04% |
| 3 | Today daily open | 1.3389 |
The pair is trading below its 20 Daily moving average @ 1.3424, below its 50 Daily moving average @ 1.3501 , below its 100 Daily moving average @ 1.3529 and above its 200 Daily moving average @ 1.3212
| Trends | Trends.1 | |
|---|---|---|
| 0 | Daily SMA20 | 1.3424 |
| 1 | Daily SMA50 | 1.3501 |
| 2 | Daily SMA100 | 1.3529 |
| 3 | Daily SMA200 | 1.3212 |
The previous day high was 1.3389 while the previous day low was 1.33. The daily 38.2% Fib levels comes at 1.3355, expected to provide support. Similarly, the daily 61.8% fib level is at 1.3334, expected to provide support.
Note the levels of interest below:
- Pivot support is noted at 1.333, 1.327, 1.324
- Pivot resistance is noted at 1.3419, 1.3449, 1.3509
| Levels | Levels.1 |
|---|---|
| Previous Daily High | 1.3389 |
| Previous Daily Low | 1.3300 |
| Previous Weekly High | 1.3428 |
| Previous Weekly Low | 1.3300 |
| Previous Monthly High | 1.3705 |
| Previous Monthly Low | 1.3385 |
| Daily Fibonacci 38.2% | 1.3355 |
| Daily Fibonacci 61.8% | 1.3334 |
| Daily Pivot Point S1 | 1.3330 |
| Daily Pivot Point S2 | 1.3270 |
| Daily Pivot Point S3 | 1.3240 |
| Daily Pivot Point R1 | 1.3419 |
| Daily Pivot Point R2 | 1.3449 |
| Daily Pivot Point R3 | 1.3509 |
[/s2If]
Join Our Telegram Group
")


