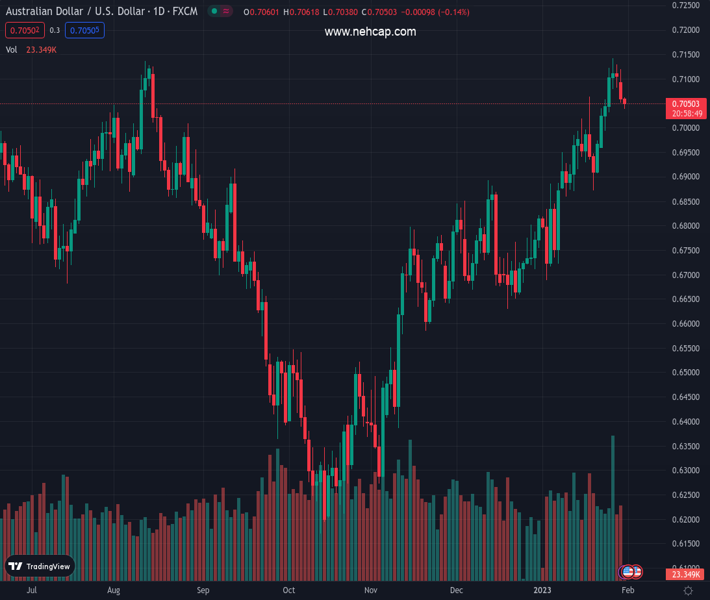
#AUDUSD @ 0.70501 has witnessed a vertical sell-off on higher-than-anticipated de-growth in Australian Retail Sales. (Pivot Orderbook analysis)
…
This is a premium post.
[s2If !current_user_can(access_s2member_level4)]Please register for PREMIUM VERSION HERE to read full post below containing analysis. In case of any error or you think you are not able to read the full post below, please email us at support#nehcap.com [lwa][/s2If] [s2If current_user_can(access_s2member_level4)]
- AUD/USD has witnessed a vertical sell-off on higher-than-anticipated de-growth in Australian Retail Sales.
- The RBA might continue to hike interest rates further as the Q4CY2022 CPI has refreshed multi-year highs at 7.8%.
- Volatility has escalated ahead of the interest rate policy by the Fed.
The pair currently trades last at 0.70501.
The previous day high was 0.712 while the previous day low was 0.7051. The daily 38.2% Fib levels comes at 0.7078, expected to provide resistance. Similarly, the daily 61.8% fib level is at 0.7094, expected to provide resistance.
The AUD/USD pair has sensed immense selling pressure and has dropped to near 0.7030 as the Australian Bureau of Statistics has reported downbeat monthly Retail Sales data (Dec). The economic data has shown a de-growth of 3.9% vs. the expectations of -0.3% and the prior release of 1.4%.
Retail demand has been slowed down dramatically despite the Christmas season, which was expected to spur consumer spending after three consecutive pandemic-locked Christmases.
Despite a massive decline in retail demand, the Reserve Bank of Australia (RBA) might continue to hike interest rates further as the fourth quarter Consumer Price Index (CPI) has refreshed multi-year highs at 7.8%.
Going forward, the Australian Dollar will dance to the tunes of the Caixin Manufacturing PMI data, which will release on Wednesday. As per the projections, the manufacturing PMI will advance to 49.5 from the prior release of 49.0. The Chinese economy is operating at full capacity levels after dismantling the pandemic controls and therefore, a recovery in economic demand cannot be ruled out.
Meanwhile, Bloomberg reported that Bloomberg’s aggregate index of eight early indicators showed a slight uptick in Chinese economic activities in January, versus a contraction in December. Also, confidence among small businesses was better in January than in December, with real estate, transport, accommodation, and catering activity seeing a sharp rebound, according to Standard Chartered Plc.
It is worth noting that Australia is a leading trading partner of China and rising economic activities in the Chinese economy will support the Australian Dollar.
On the United States front, the US Dollar Index (DXY) is aiming to extend its upside journey after a minor pullback. Volatility has been spurted ahead of the interest rate decision by the Federal Reserve (Fed), which has trimmed the risk appetite of the market participants.
Technical Levels: Supports and Resistances
AUDUSD currently trading at 0.7061 at the time of writing. Pair opened at 0.7058 and is trading with a change of 0.04 % .
| Overview | Overview.1 | |
|---|---|---|
| 0 | Today last price | 0.7061 |
| 1 | Today Daily Change | 0.0003 |
| 2 | Today Daily Change % | 0.0400 |
| 3 | Today daily open | 0.7058 |
The pair remains strongly bullish on the daily timeframe. It trades above its 20 SMA @ 0.6954, 50 SMA 0.6825, 100 SMA @ 0.6657 and 200 SMA @ 0.6812.
| Trends | Trends.1 | |
|---|---|---|
| 0 | Daily SMA20 | 0.6954 |
| 1 | Daily SMA50 | 0.6825 |
| 2 | Daily SMA100 | 0.6657 |
| 3 | Daily SMA200 | 0.6812 |
The previous day high was 0.712 while the previous day low was 0.7051. The daily 38.2% Fib levels comes at 0.7078, expected to provide resistance. Similarly, the daily 61.8% fib level is at 0.7094, expected to provide resistance.
Note the levels of interest below:
- Pivot support is noted at 0.7033, 0.7007, 0.6964
- Pivot resistance is noted at 0.7102, 0.7146, 0.7171
| Levels | Levels.1 |
|---|---|
| Previous Daily High | 0.7120 |
| Previous Daily Low | 0.7051 |
| Previous Weekly High | 0.7143 |
| Previous Weekly Low | 0.6960 |
| Previous Monthly High | 0.6893 |
| Previous Monthly Low | 0.6629 |
| Daily Fibonacci 38.2% | 0.7078 |
| Daily Fibonacci 61.8% | 0.7094 |
| Daily Pivot Point S1 | 0.7033 |
| Daily Pivot Point S2 | 0.7007 |
| Daily Pivot Point S3 | 0.6964 |
| Daily Pivot Point R1 | 0.7102 |
| Daily Pivot Point R2 | 0.7146 |
| Daily Pivot Point R3 | 0.7171 |
[/s2If]
Join Our Telegram Group
")


