#XAUUSD @ 1,922.23 Gold price is expected to continue its downside journey toward $1,920.00 amid a solid USD Index. (Pivot Orderbook analysis)
…
This is a premium post.
[s2If !current_user_can(access_s2member_level4)]Please register for PREMIUM VERSION HERE to read full post below containing analysis. In case of any error or you think you are not able to read the full post below, please email us at support#nehcap.com [lwa][/s2If] [s2If current_user_can(access_s2member_level4)]
- Gold price is expected to continue its downside journey toward $1,920.00 amid a solid USD Index.
- The Fed is expected to announce a smaller interest rate hike as US inflation is in a downtrend.
- The US labor market has remained extremely tight in CY2022 but the continuation of rate hikes is denting producers’ optimism.
The pair currently trades last at 1922.23.
The previous day high was 1934.54 while the previous day low was 1920.67. The daily 38.2% Fib levels comes at 1925.97, expected to provide resistance. Similarly, the daily 61.8% fib level is at 1929.24, expected to provide resistance.
Gold price (XAU/USD) is scaling downside towards the immediate support of $1,920.00 in the Asian session. The precious metal has been displaying a topsy-turvy move amid rising traction for the US Dollar Index (DXY) ahead of the interest rate decision by the Federal Reserve (Fed), which is scheduled for Wednesday. The Gold price is auctioning in a $1,922-1,933 range and is expected to remain on tenterhooks ahead.
S&P500 futures have added some gains after a sheer sell-off on Monday, portraying that optimism is stemming as the Fed is expected to slow down the pace of hiking interest rates. The USD Index is looking to extend its breakout above the 101.80 resistance to near 102.00 amid overall pessimism in the market. Also, the risk-aversion theme underpinned by the market participants is supporting the 10-year US Treasury yields, which have shifted above 3.54%.
In addition to the Fed’s interest rate policy, the release of the United States Automatic Data Processing (ADP) Employment data will keep volatility at its peak. According to the estimates, the economic data is seen at 170K, lower than the former release of 235K.
The US labor market has remained extremely tight in CY2022 but the continuation of interest rate hikes by Fed chair Jerome Powell is denting the expression of optimism in producers. Firms are aiming to optimally use their current labor force to handle operations and have paused the recruitment process due to the dismal economic outlook.
Gold price has formed a Head and Shoulder chart pattern on an hourly scale, which indicates a prolonged consolidation. The precious metal might demonstrate a bearish reversal after a breakdown below the neckline plotted from January 24 low at $1,917.20.
A bear cross, represented by the 20-and 50-period Exponential Moving Average (EMAs), adds to the downside filters.
The Relative Strength Index (RSI) (14) has yet not surrendered the 40.00-60.00 range. A breakdown into the 20.00-40.00 range will trigger the downside momentum.
Technical Levels: Supports and Resistances
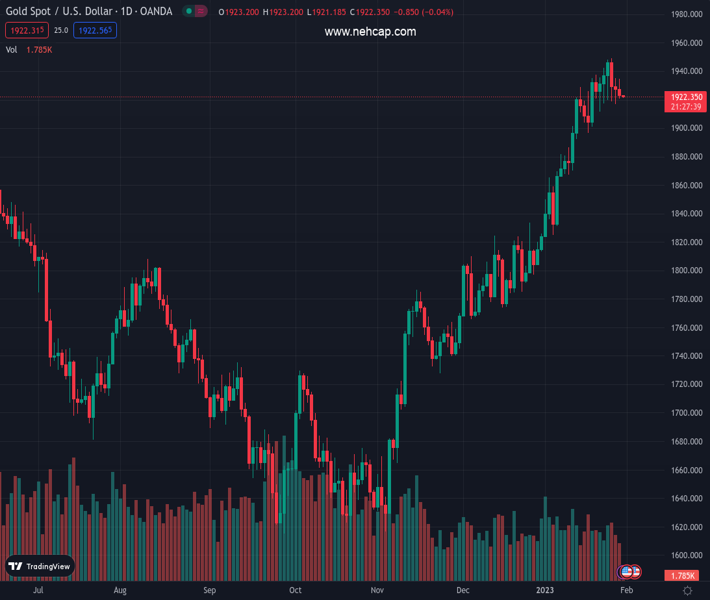
XAUUSD currently trading at 1922.16 at the time of writing. Pair opened at 1922.14 and is trading with a change of 0.0 % .
| Overview | Overview.1 | |
|---|---|---|
| 0 | Today last price | 1922.16 |
| 1 | Today Daily Change | 0.02 |
| 2 | Today Daily Change % | 0.00 |
| 3 | Today daily open | 1922.14 |
The pair remains strongly bullish on the daily timeframe. It trades above its 20 SMA @ 1901.06, 50 SMA 1832.91, 100 SMA @ 1757.26 and 200 SMA @ 1775.6.
| Trends | Trends.1 | |
|---|---|---|
| 0 | Daily SMA20 | 1901.06 |
| 1 | Daily SMA50 | 1832.91 |
| 2 | Daily SMA100 | 1757.26 |
| 3 | Daily SMA200 | 1775.60 |
The previous day high was 1934.54 while the previous day low was 1920.67. The daily 38.2% Fib levels comes at 1925.97, expected to provide resistance. Similarly, the daily 61.8% fib level is at 1929.24, expected to provide resistance.
Note the levels of interest below:
- Pivot support is noted at 1917.03, 1911.91, 1903.16
- Pivot resistance is noted at 1930.9, 1939.65, 1944.77
| Levels | Levels.1 |
|---|---|
| Previous Daily High | 1934.54 |
| Previous Daily Low | 1920.67 |
| Previous Weekly High | 1949.27 |
| Previous Weekly Low | 1911.45 |
| Previous Monthly High | 1833.38 |
| Previous Monthly Low | 1765.89 |
| Daily Fibonacci 38.2% | 1925.97 |
| Daily Fibonacci 61.8% | 1929.24 |
| Daily Pivot Point S1 | 1917.03 |
| Daily Pivot Point S2 | 1911.91 |
| Daily Pivot Point S3 | 1903.16 |
| Daily Pivot Point R1 | 1930.90 |
| Daily Pivot Point R2 | 1939.65 |
| Daily Pivot Point R3 | 1944.77 |
[/s2If]
Join Our Telegram Group
")


