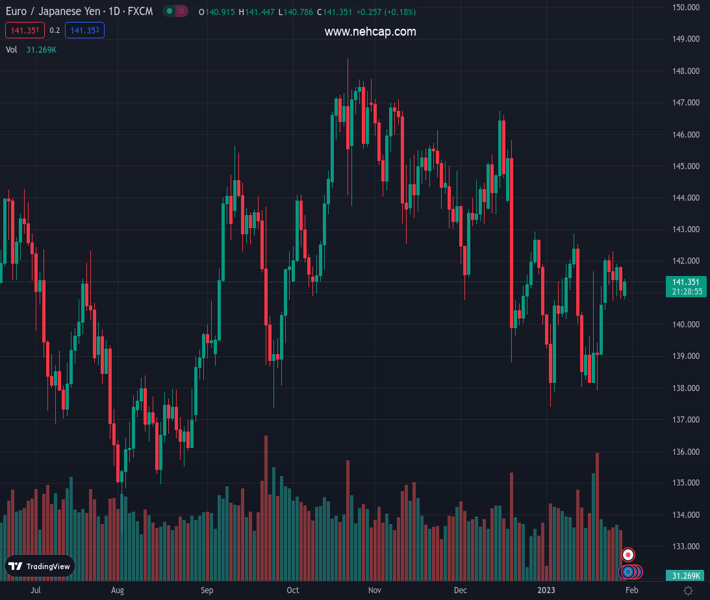
#EURJPY @ 141.342 The Euro bulls are showing strength ahead of the German GDP data release. (Pivot Orderbook analysis)
…
This is a premium post.
[s2If !current_user_can(access_s2member_level4)]Please register for PREMIUM VERSION HERE to read full post below containing analysis. In case of any error or you think you are not able to read the full post below, please email us at support#nehcap.com [lwa][/s2If] [s2If current_user_can(access_s2member_level4)]
- The Euro bulls are showing strength ahead of the German GDP data release.
- A recovery move above the 20-EMA indicates the short-term trend is bullish.
- The RSI (14) is still in the 40.00-60.00 range, showing the absence of a potential trigger.
The pair currently trades last at 141.342.
The previous day high was 141.92 while the previous day low was 140.82. The daily 38.2% Fib levels comes at 141.24, expected to provide support. Similarly, the daily 61.8% fib level is at 141.5, expected to provide resistance.
The EUR/JPY pair sensed a significant buying interest after dropping to near the four-day low around 140.80 in the early Asian session. The cross has picked demand ahead of the release of the preliminary German Gross Domestic Product (GDP) (Q4) data, which will release on Monday. The economic data is seen at 0% lower than the prior figure of 0.4% on a quarterly basis.
This week, the event that will keep the asset volatile is the interest rate decision by the European Central Bank (ECB), which will release on Thursday. Considering Eurozone’s roaring inflation, European Central Bank (ECB) President Christine Lagarde will push the interest rates higher by 50 basis points (bps) to 2.50%.
EUR/JPY is displaying rangebound action broadly in a Descending Triangle chart pattern on an hourly scale. The downward-sloping trendline of the above-mentioned chart pattern is plotted from January 25 high at 142.29 while the horizontal support is placed from January 25 low around 140.76. On a broader basis, the south side trendline from January 11 high at 142.61 will act as a major barricade for the Euro bulls.
The recovery move from the horizontal support of the chart pattern has pushed the cross above the 20-period Exponential Moving Average (EMA) at 141.22, which indicates that the short-term trend is turning bullish.
While the Relative Strength Index (RSI) (14) is still oscillating in a 40.00-60.00 range, which indicates a consolidation ahead.
For an upside move, the cross needs to surpass January 25 high at 142.29, which will drive the asset toward January 11 high at 142.61 followed by October 24 low at 143.72.
On the flip side, a break below January 25 low around 140.76 will be a breakdown of the chart pattern, which will drag the asset towards January 5 low at 140.14. A slippage below the same will expose the cross for more downside toward January 17 high at 139.62.
Technical Levels: Supports and Resistances
EURJPY currently trading at 141.42 at the time of writing. Pair opened at 141.12 and is trading with a change of 0.21 % .
| Overview | Overview.1 | |
|---|---|---|
| 0 | Today last price | 141.42 |
| 1 | Today Daily Change | 0.30 |
| 2 | Today Daily Change % | 0.21 |
| 3 | Today daily open | 141.12 |
The pair is trading above its 20 Daily moving average @ 140.42, below its 50 Daily moving average @ 142.13 , below its 100 Daily moving average @ 143.1 and above its 200 Daily moving average @ 140.86
| Trends | Trends.1 | |
|---|---|---|
| 0 | Daily SMA20 | 140.42 |
| 1 | Daily SMA50 | 142.13 |
| 2 | Daily SMA100 | 143.10 |
| 3 | Daily SMA200 | 140.86 |
The previous day high was 141.92 while the previous day low was 140.82. The daily 38.2% Fib levels comes at 141.24, expected to provide support. Similarly, the daily 61.8% fib level is at 141.5, expected to provide resistance.
Note the levels of interest below:
- Pivot support is noted at 140.65, 140.19, 139.56
- Pivot resistance is noted at 141.75, 142.38, 142.85
| Levels | Levels.1 |
|---|---|
| Previous Daily High | 141.92 |
| Previous Daily Low | 140.82 |
| Previous Weekly High | 142.30 |
| Previous Weekly Low | 140.47 |
| Previous Monthly High | 146.73 |
| Previous Monthly Low | 138.80 |
| Daily Fibonacci 38.2% | 141.24 |
| Daily Fibonacci 61.8% | 141.50 |
| Daily Pivot Point S1 | 140.65 |
| Daily Pivot Point S2 | 140.19 |
| Daily Pivot Point S3 | 139.56 |
| Daily Pivot Point R1 | 141.75 |
| Daily Pivot Point R2 | 142.38 |
| Daily Pivot Point R3 | 142.85 |
[/s2If]
Join Our Telegram Group


