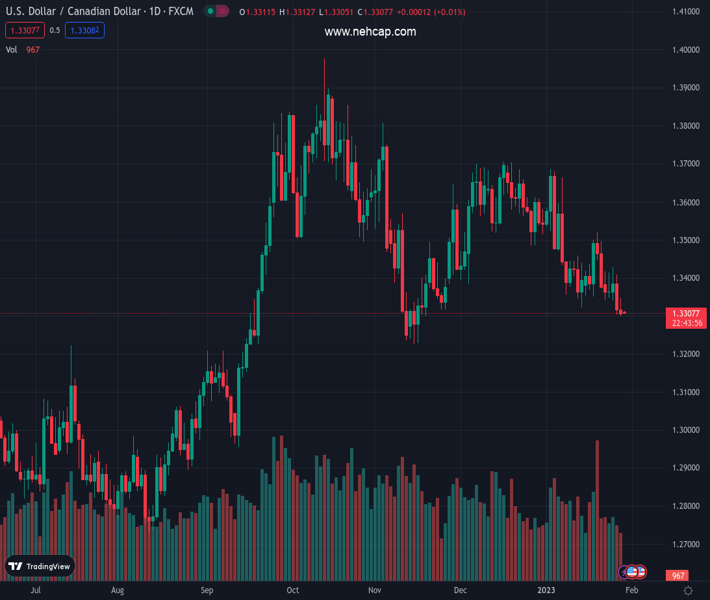
#USDCAD @ 1.33090 is building a firmer cushion around 1.330 amid sheer weakness in the oil price. (Pivot Orderbook analysis)
…
This is a premium post.
[s2If !current_user_can(access_s2member_level4)]Please register for PREMIUM VERSION HERE to read full post below containing analysis. In case of any error or you think you are not able to read the full post below, please email us at support#nehcap.com [lwa][/s2If] [s2If current_user_can(access_s2member_level4)]
- USD/CAD is building a firmer cushion around 1.330 amid sheer weakness in the oil price.
- The US labor market might not remain tight enough as opportunities are declining amid a bleak economic outlook.
- The rising oil supply from Russia at discounted prices to Asia triggered volatility in the oil price.
The pair currently trades last at 1.33090.
The previous day high was 1.3347 while the previous day low was 1.33. The daily 38.2% Fib levels comes at 1.3318, expected to provide resistance. Similarly, the daily 61.8% fib level is at 1.3329, expected to provide resistance.
The USD/CAD pair is gauging an intermediate cushion around 1.3300 in the early Asian session. The Loonie asset is showing signs of exhaustion in the downside trend despite the upbeat market mood. A sheer fall in the oil price was driven by weaker demand projections in the United States due to the expectations of an upcoming fresh interest rate hike by the Federal Reserve (Fed) on Wednesday.
The US Dollar Index (DXY) is auctioning inside the woods from the past few trading sessions amid ambiguity in the market sentiment on a broader note. The upside in the USD Index is capped around 101.80 while the downside is supported near 101.20.
S&P500 settled January last week on a positive note despite softening demand as reported by the United States core Personal Consumption Expenditure (PCE) Price Index (Dec) data. Corporate earnings are being impacted by declining retail demand but are delighted by the Federal Reserve (Fed) as it adds to the downside filters for inflation.
This week, the primary catalyst that will keep investors uneasy is the interest rate decision by the Fed on Wednesday. As per the CME FedWatch tool, Fed chair Jerome Powell might increase interest rates by 25 basis points (bps) to 4.50-4.75%. But before that, the release of the Automatic Data Processing (ADP) Employment data will remain in focus. The economic data is seen at 86K, significantly lower than the former release of 235K. Labor demand is softening dramatically as firms have paused their recruitment process due to the bleak economic outlook.
On the oil front, investors dumped the oil price late Friday after Reuters reported that Russia’s oil loadings from its Baltic ports were set to rise by 50% in January from December levels in order to address the strong demand coming from Asia. Russian oil supply is accelerating despite the sanctions by the Western cartel. It is worth noting that Canada is a leading exporter of oil to the United States and lower oil prices impact the Canadian Dollar.
Technical Levels: Supports and Resistances
USDCAD currently trading at 1.3313 at the time of writing. Pair opened at 1.3312 and is trading with a change of 0.01 % .
| Overview | Overview.1 | |
|---|---|---|
| 0 | Today last price | 1.3313 |
| 1 | Today Daily Change | 0.0001 |
| 2 | Today Daily Change % | 0.0100 |
| 3 | Today daily open | 1.3312 |
The pair is trading below its 20 Daily moving average @ 1.3433, below its 50 Daily moving average @ 1.3503 , below its 100 Daily moving average @ 1.3525 and above its 200 Daily moving average @ 1.3208
| Trends | Trends.1 | |
|---|---|---|
| 0 | Daily SMA20 | 1.3433 |
| 1 | Daily SMA50 | 1.3503 |
| 2 | Daily SMA100 | 1.3525 |
| 3 | Daily SMA200 | 1.3208 |
The previous day high was 1.3347 while the previous day low was 1.33. The daily 38.2% Fib levels comes at 1.3318, expected to provide resistance. Similarly, the daily 61.8% fib level is at 1.3329, expected to provide resistance.
Note the levels of interest below:
- Pivot support is noted at 1.3293, 1.3273, 1.3246
- Pivot resistance is noted at 1.3339, 1.3366, 1.3385
| Levels | Levels.1 |
|---|---|
| Previous Daily High | 1.3347 |
| Previous Daily Low | 1.3300 |
| Previous Weekly High | 1.3428 |
| Previous Weekly Low | 1.3300 |
| Previous Monthly High | 1.3705 |
| Previous Monthly Low | 1.3385 |
| Daily Fibonacci 38.2% | 1.3318 |
| Daily Fibonacci 61.8% | 1.3329 |
| Daily Pivot Point S1 | 1.3293 |
| Daily Pivot Point S2 | 1.3273 |
| Daily Pivot Point S3 | 1.3246 |
| Daily Pivot Point R1 | 1.3339 |
| Daily Pivot Point R2 | 1.3366 |
| Daily Pivot Point R3 | 1.3385 |
[/s2If]
Join Our Telegram Group


