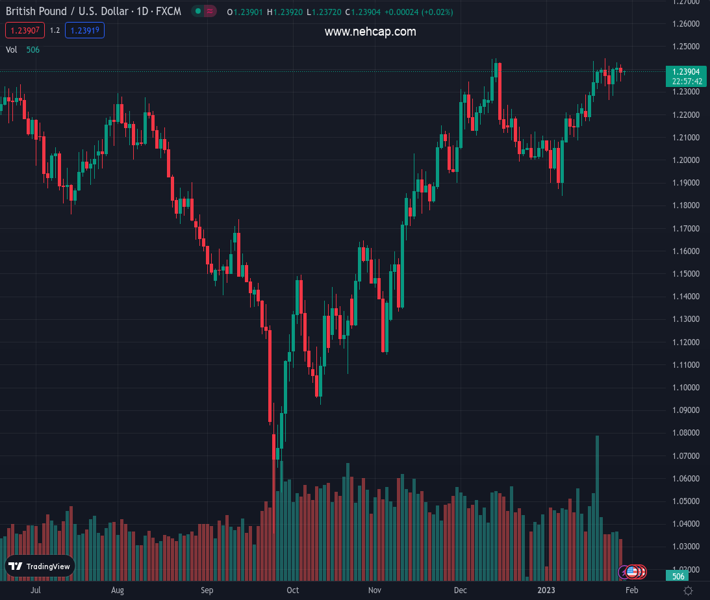
#GBPUSD @ 1.23874 has dropped after facing barricades around 1.2400 despite the upbeat market mood. (Pivot Orderbook analysis)
…
This is a premium post.
[s2If !current_user_can(access_s2member_level4)]Please register for PREMIUM VERSION HERE to read full post below containing analysis. In case of any error or you think you are not able to read the full post below, please email us at support#nehcap.com [lwa][/s2If] [s2If current_user_can(access_s2member_level4)]
- GBP/USD has dropped after facing barricades around 1.2400 despite the upbeat market mood.
- Volatility to remain squeezed ahead of the Fed-BoE interest rate policy.
- An oscillation by the RSI (14) in the 40.00-60.00 range indicates a consolidation head.
The pair currently trades last at 1.23874.
The previous day high was 1.2419 while the previous day low was 1.2346. The daily 38.2% Fib levels comes at 1.2374, expected to provide support. Similarly, the daily 61.8% fib level is at 1.2391, expected to provide resistance.
The GBP/USD pair has sensed selling interest near the round-level resistance of 1.2400 in early Asia after a gradual upside move. The cable is expected to remain on the tenterhooks as investors are shifting their focus toward the announcement of the interest rate decision by the Federal Reserve (Fed) and the Bank of England (BoE) this week.
Meanwhile, the risk appetite of the market participants has been improved after a decline in the United States core Personal Consumption Expenditure (PCE) price index (Dec), which signified that the overall demand is softening along with inflationary pressures. The US Dollar Index (DXY) is continuously declining from its capped upside around 101.80.
On an hourly scale, GBP/USD is auctioning in an Ascending Triangle chart pattern, which indicates a slippage in volatility. The rationale behind the volatility contraction should be the monetary policy announcements by the Fed and the BoE this week. The upward-sloping trendline of the above-mentioned chart pattern is plotted from January 24 low at 1.2263 while the horizontal resistance is placed from January 24 high around 1.2414.
The 20- period Exponential Moving Average (EMA) at 1.2382 is overlapping the cable, which indicates consolidation ahead.
Also, the Relative Strength Index (RSI) (14) is oscillating in a 40.00-60.00 range, which indicates an absence of a potential trigger for a decisive move.
Should the Cable break above the seven-month high of 1.2448 decisively, Pound Sterling bulls will drive the asset towards the psychological resistance of 1.2500 and the June 7 high around 1.2600.
The Cable will display a sheer downside if it drops below Monday’s low at 1.2171 as it will drag the major toward January 11 low at 1.2100 followed by the psychological support at 1.2000.
Technical Levels: Supports and Resistances
GBPUSD currently trading at 1.2388 at the time of writing. Pair opened at 1.2391 and is trading with a change of -0.02 % .
| Overview | Overview.1 | |
|---|---|---|
| 0 | Today last price | 1.2388 |
| 1 | Today Daily Change | -0.0003 |
| 2 | Today Daily Change % | -0.0200 |
| 3 | Today daily open | 1.2391 |
The pair remains strongly bullish on the daily timeframe. It trades above its 20 SMA @ 1.2226, 50 SMA 1.2163, 100 SMA @ 1.1766 and 200 SMA @ 1.1963.
| Trends | Trends.1 | |
|---|---|---|
| 0 | Daily SMA20 | 1.2226 |
| 1 | Daily SMA50 | 1.2163 |
| 2 | Daily SMA100 | 1.1766 |
| 3 | Daily SMA200 | 1.1963 |
The previous day high was 1.2419 while the previous day low was 1.2346. The daily 38.2% Fib levels comes at 1.2374, expected to provide support. Similarly, the daily 61.8% fib level is at 1.2391, expected to provide resistance.
Note the levels of interest below:
- Pivot support is noted at 1.2351, 1.2312, 1.2278
- Pivot resistance is noted at 1.2425, 1.2459, 1.2498
| Levels | Levels.1 |
|---|---|
| Previous Daily High | 1.2419 |
| Previous Daily Low | 1.2346 |
| Previous Weekly High | 1.2448 |
| Previous Weekly Low | 1.2263 |
| Previous Monthly High | 1.2447 |
| Previous Monthly Low | 1.1992 |
| Daily Fibonacci 38.2% | 1.2374 |
| Daily Fibonacci 61.8% | 1.2391 |
| Daily Pivot Point S1 | 1.2351 |
| Daily Pivot Point S2 | 1.2312 |
| Daily Pivot Point S3 | 1.2278 |
| Daily Pivot Point R1 | 1.2425 |
| Daily Pivot Point R2 | 1.2459 |
| Daily Pivot Point R3 | 1.2498 |
[/s2If]
Join Our Telegram Group


