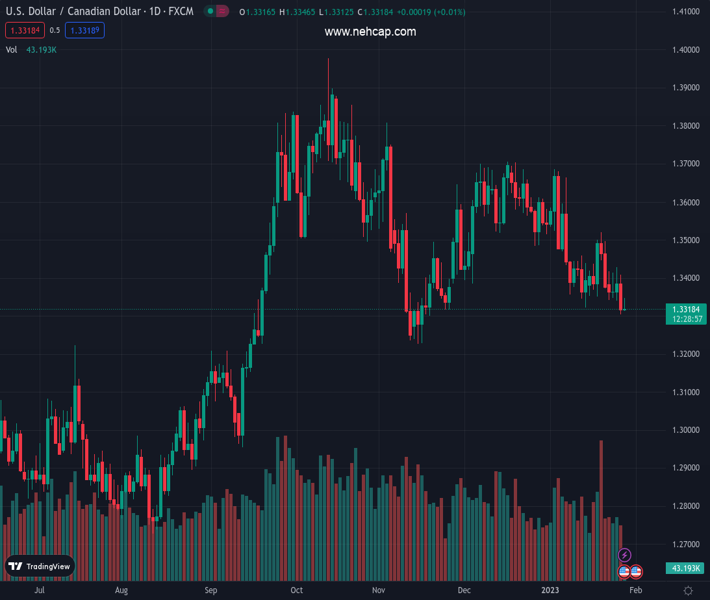
#USDCAD @ 1.33185 regains some positive traction on Friday amid a modest pickup in the USD demand. (Pivot Orderbook analysis)
…
This is a premium post.
[s2If !current_user_can(access_s2member_level4)]Please register for PREMIUM VERSION HERE to read full post below containing analysis. In case of any error or you think you are not able to read the full post below, please email us at support#nehcap.com [lwa][/s2If] [s2If current_user_can(access_s2member_level4)]
- USD/CAD regains some positive traction on Friday amid a modest pickup in the USD demand.
- Thursday’s upbeat US macro data fuels hawkish Fed expectations and benefits the greenback.
- Bullish crude oil prices continue to underpin the Loonie and keep a lid on any further gains.
- Traders now eye the US PCE report for a fresh impetus ahead of the FOMC meeting next week.
The pair currently trades last at 1.33185.
The previous day high was 1.3408 while the previous day low was 1.3303. The daily 38.2% Fib levels comes at 1.3343, expected to provide resistance. Similarly, the daily 61.8% fib level is at 1.3368, expected to provide resistance.
The USD/CAD pair attracts some buyers on Friday and reverses a part of the previous day’s slide to the 1.3300 mark, or its lowest level since November 17. The pair sticks to its intraday gains through the early European session and is currently placed near the daily top, just below mid-1.3300s.
The US Dollar draws support from the mostly upbeat US macro data released on Thursday and edges higher on the last day of the week, which, in turn, is acting as a tailwind for the USD/CAD pair. In fact, the US Commerce Department reported that the economy expanded at a 2.9% annualised pace during the fourth quarter against consensus estimates for a reading of 2.6%. The stronger-than-expected growth figures could allow the Fed to maintain its hawkish stance for longer. This pushes the US Treasury bond yields higher and continues to benefit the greenback.
The markets, however, still seem convinced that the Fed will slow the pace of its policy-tightening and deliver a smaller 25 bps rate hike in February. This holds back the USD bulls from placing aggressive bets. Apart from this, the underlying bullish sentiment surrounding crude oil prices is underpinning the commodity-linked Loonie. The aforementioned factors should contribute to capping any meaningful upside for the USD/CAD pair. Traders might also prefer to wait for the release of the US Core PCE Price Index, due later during the early North American session.
The key focus, however, will remain glued to the outcome of the highly-anticipated two-day FOMC policy meeting, scheduled to be announced next week. In the meantime, the US bond yields and the broader risk sentiment will drive the USD demand. Apart from this, oil price dynamics should provide some impetus to the USD/CAD pair and assist traders to grab short-term opportunities.
Technical Levels: Supports and Resistances
USDCAD currently trading at 1.3335 at the time of writing. Pair opened at 1.3324 and is trading with a change of 0.08 % .
| Overview | Overview.1 | |
|---|---|---|
| 0 | Today last price | 1.3335 |
| 1 | Today Daily Change | 0.0011 |
| 2 | Today Daily Change % | 0.0800 |
| 3 | Today daily open | 1.3324 |
The pair is trading below its 20 Daily moving average @ 1.3445, below its 50 Daily moving average @ 1.3504 , below its 100 Daily moving average @ 1.3522 and above its 200 Daily moving average @ 1.3205
| Trends | Trends.1 | |
|---|---|---|
| 0 | Daily SMA20 | 1.3445 |
| 1 | Daily SMA50 | 1.3504 |
| 2 | Daily SMA100 | 1.3522 |
| 3 | Daily SMA200 | 1.3205 |
The previous day high was 1.3408 while the previous day low was 1.3303. The daily 38.2% Fib levels comes at 1.3343, expected to provide resistance. Similarly, the daily 61.8% fib level is at 1.3368, expected to provide resistance.
Note the levels of interest below:
- Pivot support is noted at 1.3282, 1.324, 1.3178
- Pivot resistance is noted at 1.3387, 1.345, 1.3492
| Levels | Levels.1 |
|---|---|
| Previous Daily High | 1.3408 |
| Previous Daily Low | 1.3303 |
| Previous Weekly High | 1.3521 |
| Previous Weekly Low | 1.3351 |
| Previous Monthly High | 1.3705 |
| Previous Monthly Low | 1.3385 |
| Daily Fibonacci 38.2% | 1.3343 |
| Daily Fibonacci 61.8% | 1.3368 |
| Daily Pivot Point S1 | 1.3282 |
| Daily Pivot Point S2 | 1.3240 |
| Daily Pivot Point S3 | 1.3178 |
| Daily Pivot Point R1 | 1.3387 |
| Daily Pivot Point R2 | 1.3450 |
| Daily Pivot Point R3 | 1.3492 |
[/s2If]
Join Our Telegram Group


