#EURUSD @ 1.08694 holds lower ground near intraday bottom, down for the second consecutive day., @nehcap view: Further downside expected (Pivot Orderbook analysis)
…
This is a premium post.
[s2If !current_user_can(access_s2member_level4)]Please register for PREMIUM VERSION HERE to read full post below containing analysis. In case of any error or you think you are not able to read the full post below, please email us at support#nehcap.com [lwa][/s2If] [s2If current_user_can(access_s2member_level4)]
- EUR/USD holds lower ground near intraday bottom, down for the second consecutive day.
- Bearish MACD signals, failure to cross 1.0930 hurdle keeps sellers hopeful.
- Fortnight-old ascending trend line defends bulls beyond 1.0820.
- Recovery needs validation from weekly hurdle to refresh multi-month high.
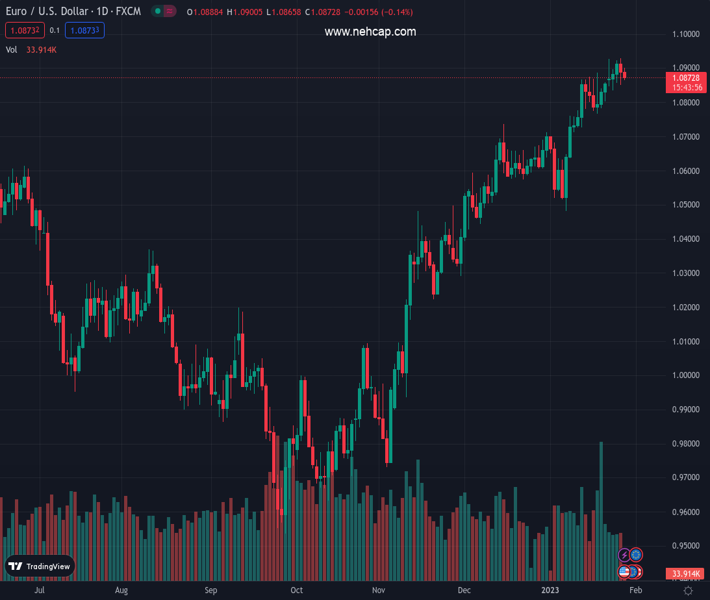
The pair currently trades last at 1.08694.
The previous day high was 1.093 while the previous day low was 1.085. The daily 38.2% Fib levels comes at 1.0881, expected to provide resistance. Similarly, the daily 61.8% fib level is at 1.0899, expected to provide resistance.
EUR/USD licks its wounds near the intraday low surrounding 1.0870 as traders await the key US inflation number during early Friday in Europe. In doing so, the major currency pair drops for the second consecutive day while staying inside a two-week-old rising trend channel formation.
It’s worth noting that the quote’s multiple failures to cross the weekly horizontal resistance near 1.0930 joins bearish MACD signals and downbeat RSI (14) to keep EUR/USD bears hopeful.
However, a clear downside break of the stated bullish channel’s support, close to 1.0840 by the press time, becomes necessary to convince EUR/USD bears.
Following that, a downward trajectory towards the 1.0700-715 region comprising the multiple levels marked in the last six weeks, as well as the 200-SMA level, will be crucial to confirm the EUR/USD bear-run.
Alternatively, a successful break of the 1.0930 horizontal resistance could propel the EUR/USD prices towards the stated channel’s upper line, close to 1.0965 by the press time.
In a case where the EUR/USD buyers keep the reins past 1.0965, the 1.1000 psychological magnet should return to the chart while any further advances may aim for the mid-March 2022 peak surrounding 1.1140.
Trend: Further downside expected
Technical Levels: Supports and Resistances
EURUSD currently trading at 1.0874 at the time of writing. Pair opened at 1.0892 and is trading with a change of -0.17% % .
| Overview | Overview.1 | |
|---|---|---|
| 0 | Today last price | 1.0874 |
| 1 | Today Daily Change | -0.0018 |
| 2 | Today Daily Change % | -0.17% |
| 3 | Today daily open | 1.0892 |
The pair remains strongly bullish on the daily timeframe. It trades above its 20 SMA @ 1.0762, 50 SMA 1.0613, 100 SMA @ 1.0269 and 200 SMA @ 1.0311.
| Trends | Trends.1 | |
|---|---|---|
| 0 | Daily SMA20 | 1.0762 |
| 1 | Daily SMA50 | 1.0613 |
| 2 | Daily SMA100 | 1.0269 |
| 3 | Daily SMA200 | 1.0311 |
The previous day high was 1.093 while the previous day low was 1.085. The daily 38.2% Fib levels comes at 1.0881, expected to provide resistance. Similarly, the daily 61.8% fib level is at 1.0899, expected to provide resistance.
Note the levels of interest below:
- Pivot support is noted at 1.0852, 1.0812, 1.0773
- Pivot resistance is noted at 1.0931, 1.097, 1.101
| Levels | Levels.1 |
|---|---|
| Previous Daily High | 1.0930 |
| Previous Daily Low | 1.0850 |
| Previous Weekly High | 1.0888 |
| Previous Weekly Low | 1.0766 |
| Previous Monthly High | 1.0736 |
| Previous Monthly Low | 1.0393 |
| Daily Fibonacci 38.2% | 1.0881 |
| Daily Fibonacci 61.8% | 1.0899 |
| Daily Pivot Point S1 | 1.0852 |
| Daily Pivot Point S2 | 1.0812 |
| Daily Pivot Point S3 | 1.0773 |
| Daily Pivot Point R1 | 1.0931 |
| Daily Pivot Point R2 | 1.0970 |
| Daily Pivot Point R3 | 1.1010 |
[/s2If]
Join Our Telegram Group


