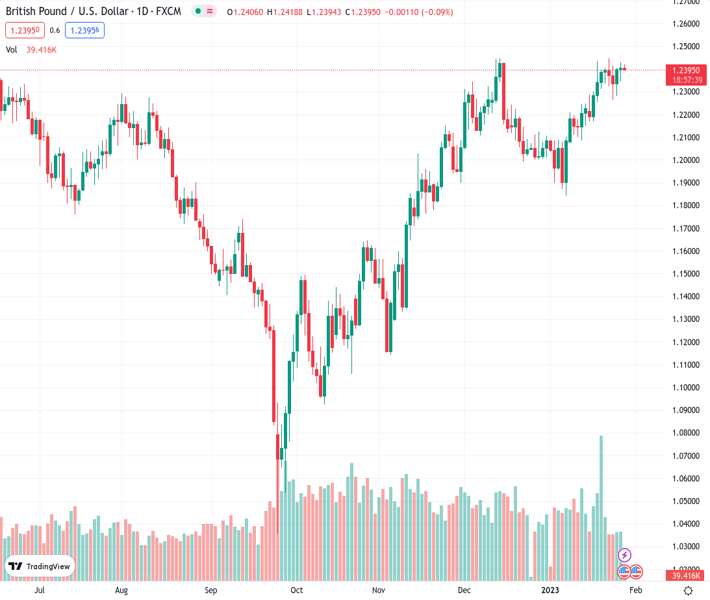
#GBPUSD @ 1.23951 clings to mild losses during the first negative day in three. (Pivot Orderbook analysis)
…
This is a premium post.
[s2If !current_user_can(access_s2member_level4)]Please register for PREMIUM VERSION HERE to read full post below containing analysis. In case of any error or you think you are not able to read the full post below, please email us at support#nehcap.com [lwa][/s2If] [s2If current_user_can(access_s2member_level4)]
- GBP/USD clings to mild losses during the first negative day in three.
- Mixed US data signals Fed’s dovish hike but chatters over BoE’s rate peak challenge Cable buyers.
- UK Treasury Secretary Hunt’s hesitance to cut the taxes also weighs on GBP/USD prices.
- Cautious mood could probe pair traders ahead of US Core PCE Price Index for December.
The pair currently trades last at 1.23951.
The previous day high was 1.243 while the previous day low was 1.2344. The daily 38.2% Fib levels comes at 1.2398, expected to provide resistance. Similarly, the daily 61.8% fib level is at 1.2377, expected to provide support.
GBP/USD sellers flirt with 1.2400, after failing to cross the 1.2430 hurdle, as cautious mood ahead of the key US data joins mixed updates from the UK to push back the previous bullish bias surrounding the Cable pair. With this, the quote prints the first daily loss in three as traders collect clues for the next week’s monetary policy meetings of the US Federal Reserve (Fed) and the Bank of England (BoE).
That said, UK Finance Minister Jeremy Hunt’s readiness to boost the growth fails to impress the GBP/USD buyers as the Chancellor defends his stand on the tax hike despite getting heavy criticism from fellow Conservatives. “British finance minister Jeremy Hunt will promise on Friday to tackle the country’s weak productivity with post-Brexit finance reforms to boost growth, but he will also stick to the tax rises that have angered some lawmakers in his Conservative Party” reported Reuters.
Alternatively, growing calls for Brexit solutions, at least from the Irish diplomats, seem to help the GBP/USD in countering the bears.
Elsewhere, mixed US data adds to the market’s anxiety ahead of the Fed’s preferred inflation gauge, namely Core Personal Consumption Expenditures (PCE) – Price Index for December. The same seemed to help the US Dollar remain lackluster and weigh on the GBP/USD prices as the odds of the Bank of England’s (BoE) nearness to policy pivot grow stronger.
That said, the US fourth-quarter (Q4) Gross Domestic Product (GDP) marked an annualized growth rate of 2.9% versus 2.6% expected and 3.2% prior. However, downbeat prints of the US Personal Consumption Expenditures (PCE) details challenged the hawkish bias of the Fed afterward.
Amid these plays, the US Treasury bond yields remain firmer but the S&P 500 Futures print mild losses despite the upbeat closing of Wall Street.
Given the market’s indecision, the GBP/USD pair may witness a further sideways move ahead of the US Core PCE – Price Index for December, expected to remain unchanged at 0.2% MoM. However, a strong US inflation signal won’t hesitate to recall the bears.
A clear break of the descending resistance line from January 18, close to 1.2430 by the press time, appears necessary for the GBP/USD bulls to keep the reins.
Also read: GBP/USD Price Analysis: Bulls approach 1.2430 key hurdle
Technical Levels: Supports and Resistances
GBPUSD currently trading at 1.2401 at the time of writing. Pair opened at 1.2414 and is trading with a change of -0.10% % .
| Overview | Overview.1 | |
|---|---|---|
| 0 | Today last price | 1.2401 |
| 1 | Today Daily Change | -0.0013 |
| 2 | Today Daily Change % | -0.10% |
| 3 | Today daily open | 1.2414 |
The pair remains strongly bullish on the daily timeframe. It trades above its 20 SMA @ 1.2211, 50 SMA 1.2153, 100 SMA @ 1.1758 and 200 SMA @ 1.1965.
| Trends | Trends.1 | |
|---|---|---|
| 0 | Daily SMA20 | 1.2211 |
| 1 | Daily SMA50 | 1.2153 |
| 2 | Daily SMA100 | 1.1758 |
| 3 | Daily SMA200 | 1.1965 |
The previous day high was 1.243 while the previous day low was 1.2344. The daily 38.2% Fib levels comes at 1.2398, expected to provide resistance. Similarly, the daily 61.8% fib level is at 1.2377, expected to provide support.
Note the levels of interest below:
- Pivot support is noted at 1.2362, 1.2311, 1.2277
- Pivot resistance is noted at 1.2448, 1.2482, 1.2534
| Levels | Levels.1 |
|---|---|
| Previous Daily High | 1.2430 |
| Previous Daily Low | 1.2344 |
| Previous Weekly High | 1.2436 |
| Previous Weekly Low | 1.2169 |
| Previous Monthly High | 1.2447 |
| Previous Monthly Low | 1.1992 |
| Daily Fibonacci 38.2% | 1.2398 |
| Daily Fibonacci 61.8% | 1.2377 |
| Daily Pivot Point S1 | 1.2362 |
| Daily Pivot Point S2 | 1.2311 |
| Daily Pivot Point S3 | 1.2277 |
| Daily Pivot Point R1 | 1.2448 |
| Daily Pivot Point R2 | 1.2482 |
| Daily Pivot Point R3 | 1.2534 |
[/s2If]
Join Our Telegram Group


