#USDCHF @ 0.92105 picks up bids to extend the previous day’s rebound from weekly low., @nehcap view: Limited recovery expected (Pivot Orderbook analysis)
…
This is a premium post.
[s2If !current_user_can(access_s2member_level4)]Please register for PREMIUM VERSION HERE to read full post below containing analysis. In case of any error or you think you are not able to read the full post below, please email us at support#nehcap.com [lwa][/s2If] [s2If current_user_can(access_s2member_level4)]
- USD/CHF picks up bids to extend the previous day’s rebound from weekly low.
- Convergence of 200-SMA, support-turned-resistance line and a descending trend line from early January appears tough nut to crack for bulls.
- Impending bull cross on MACD, sustained bounce off 23.6% Fibonacci retracement suggest further recovery.
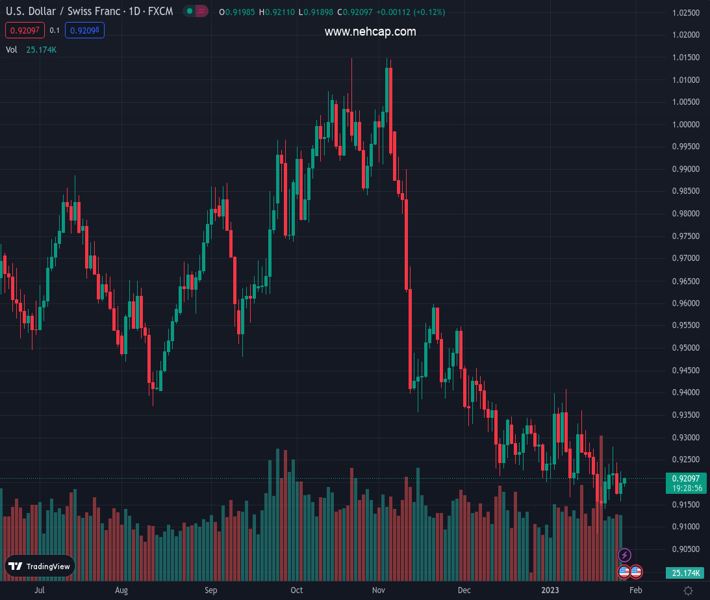
The pair currently trades last at 0.92105.
The previous day high was 0.9226 while the previous day low was 0.9158. The daily 38.2% Fib levels comes at 0.92, expected to provide support. Similarly, the daily 61.8% fib level is at 0.9184, expected to provide support.
USD/CHF grinds higher past 0.9200, mildly bid while extending the previous day’s rebound from the week’s low during early Friday. In doing so, the Swiss currency pair rebounds from the 23.6% Fibonacci retracement level of its January 06-18 downside, near 0.9160 by the press time.
It’s worth noting that the looming bull cross on the MACD adds strength to the USD/CHF rebound from 0.9160 support, which in turn signals further advances of the pair.
As a result, the 200-SMA, downward-sloping resistance line from early January and the one-week-old previous support line, close to 0.9255-60, appear the key hurdle for the USD/CHF bulls before retaking control.
In a case where the pair rises past 0.9260, the odds of witnessing a run-up toward the monthly high near 0.9410 can’t be ruled out. However, the 61.8% Fibonacci retracement level near 0.9285 and the 0.9300 round figure may act as intermediate halts during the expected rally.
Alternatively, pullback moves need to conquer the 23.6% Fibonacci retracement level surrounding 0.9160 to retake control.
Following that, a downward trajectory towards the monthly low surrounding 0.9085 can’t be ruled out.
It should be observed, however, that the USD/CHF weakness past 0.9085 makes it vulnerable to declining toward the August 2021 low near 0.9020.
Trend: Limited recovery expected
Technical Levels: Supports and Resistances
USDCHF currently trading at 0.9206 at the time of writing. Pair opened at 0.9202 and is trading with a change of 0.04% % .
| Overview | Overview.1 | |
|---|---|---|
| 0 | Today last price | 0.9206 |
| 1 | Today Daily Change | 0.0004 |
| 2 | Today Daily Change % | 0.04% |
| 3 | Today daily open | 0.9202 |
The pair remains strongly bearish on the daily time frame. It trades below the 20 SMA @ 0.9247, 50 SMA 0.9325, 100 SMA @ 0.9573 and 200 SMA @ 0.9634.
| Trends | Trends.1 | |
|---|---|---|
| 0 | Daily SMA20 | 0.9247 |
| 1 | Daily SMA50 | 0.9325 |
| 2 | Daily SMA100 | 0.9573 |
| 3 | Daily SMA200 | 0.9634 |
The previous day high was 0.9226 while the previous day low was 0.9158. The daily 38.2% Fib levels comes at 0.92, expected to provide support. Similarly, the daily 61.8% fib level is at 0.9184, expected to provide support.
Note the levels of interest below:
- Pivot support is noted at 0.9165, 0.9128, 0.9098
- Pivot resistance is noted at 0.9232, 0.9262, 0.9299
| Levels | Levels.1 |
|---|---|
| Previous Daily High | 0.9226 |
| Previous Daily Low | 0.9158 |
| Previous Weekly High | 0.9288 |
| Previous Weekly Low | 0.9085 |
| Previous Monthly High | 0.9471 |
| Previous Monthly Low | 0.9201 |
| Daily Fibonacci 38.2% | 0.9200 |
| Daily Fibonacci 61.8% | 0.9184 |
| Daily Pivot Point S1 | 0.9165 |
| Daily Pivot Point S2 | 0.9128 |
| Daily Pivot Point S3 | 0.9098 |
| Daily Pivot Point R1 | 0.9232 |
| Daily Pivot Point R2 | 0.9262 |
| Daily Pivot Point R3 | 0.9299 |
[/s2If]
Join Our Telegram Group


