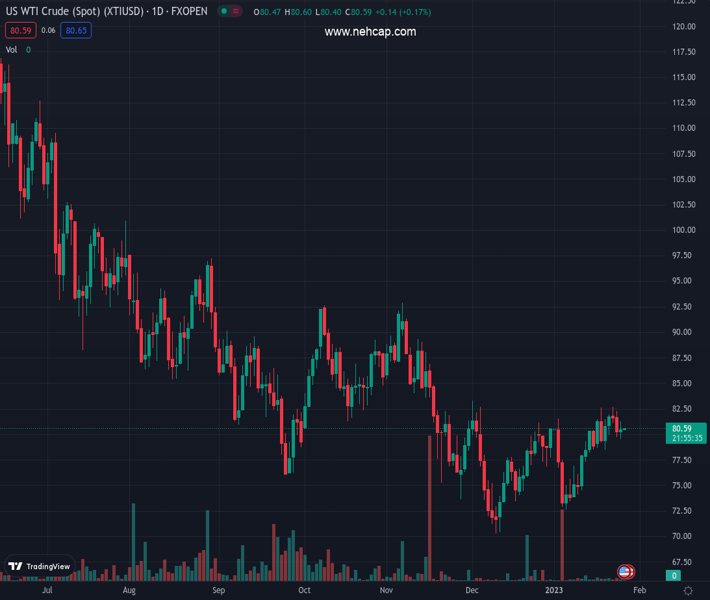
Oil price is oscillating around $80.50 as investors await US GDP for fresh cues. (Pivot Orderbook analysis)
…
This is a premium post.
[s2If !current_user_can(access_s2member_level4)]Please register for PREMIUM VERSION HERE to read full post below containing analysis. In case of any error or you think you are not able to read the full post below, please email us at support#nehcap.com [lwa][/s2If] [s2If current_user_can(access_s2member_level4)]
- Oil price is oscillating around $80.50 as investors await US GDP for fresh cues.
- The black gold has not shown any power-pack action despite a smaller-than-expected jump in oil inventories.
- United States President Joe Biden is considering refilling the Strategic Petroleum Reserve.
The pair currently trades last at 80.51.
The previous day high was 82.29 while the previous day low was 79.74. The daily 38.2% Fib levels comes at 80.71, expected to provide resistance. Similarly, the daily 61.8% fib level is at 81.32, expected to provide resistance.
West Texas Intermediate (WTI), futures on NYMEX, is displaying back-and-forth moves around $80.50 in the early Asian session. The black gold is displaying a sideways auction as investors are awaiting the release of the United States Gross Domestic Product (GDP) data for fresh impetus. According to the estimates, the US GDP is expected to shrink to 2.8% vs. the prior release of 3.2%.
The declining scale of economic activities indicates the consequences of rising interest rates by the Federal Reserve (Fed). A contraction in economic activities clears that the oil demand is facing pressure, which could hurt the oil prices ahead. On the same note, the chances of a slowdown in the pace of the interest rate hike by the Fed will accelerate as a contraction in economic activities will also strengthen recession fears.
The oil price has not shown a power-pack action despite the release of the lower-than-anticipated increase in the oil inventories reported by the US Energy Information Administration (EIA). For the week ending January 20, the EIA has reported an increase in oil stockpiles by 533,000 barrels vs. the expectations of 971,000 barrels.
Meanwhile, celebrations of the Lunar New Year in China have triggered short-term pain in the oil price. Economic activities have dropped significantly which has trimmed the oil demand and might result in a pile-up of oil inventories.
On the supply front, the United States is considering refilling of the Strategic Petroleum Reserve (SPR). US President Joe Biden exploited the oil reserves in CY2022 to fight rising oil prices, which could result in a fresh rally in the oil price ahead.
Technical Levels: Supports and Resistances
XTIUSD currently trading at 80.51 at the time of writing. Pair opened at 80.18 and is trading with a change of 0.41 % .
| Overview | Overview.1 | |
|---|---|---|
| 0 | Today last price | 80.51 |
| 1 | Today Daily Change | 0.33 |
| 2 | Today Daily Change % | 0.41 |
| 3 | Today daily open | 80.18 |
The pair is trading above its 20 Daily moving average @ 78.4, above its 50 Daily moving average @ 77.95 , below its 100 Daily moving average @ 81.7 and below its 200 Daily moving average @ 91.73
| Trends | Trends.1 | |
|---|---|---|
| 0 | Daily SMA20 | 78.40 |
| 1 | Daily SMA50 | 77.95 |
| 2 | Daily SMA100 | 81.70 |
| 3 | Daily SMA200 | 91.73 |
The previous day high was 82.29 while the previous day low was 79.74. The daily 38.2% Fib levels comes at 80.71, expected to provide resistance. Similarly, the daily 61.8% fib level is at 81.32, expected to provide resistance.
Note the levels of interest below:
- Pivot support is noted at 79.18, 78.19, 76.63
- Pivot resistance is noted at 81.73, 83.29, 84.28
| Levels | Levels.1 |
|---|---|
| Previous Daily High | 82.29 |
| Previous Daily Low | 79.74 |
| Previous Weekly High | 82.67 |
| Previous Weekly Low | 78.48 |
| Previous Monthly High | 83.30 |
| Previous Monthly Low | 70.27 |
| Daily Fibonacci 38.2% | 80.71 |
| Daily Fibonacci 61.8% | 81.32 |
| Daily Pivot Point S1 | 79.18 |
| Daily Pivot Point S2 | 78.19 |
| Daily Pivot Point S3 | 76.63 |
| Daily Pivot Point R1 | 81.73 |
| Daily Pivot Point R2 | 83.29 |
| Daily Pivot Point R3 | 84.28 |
[/s2If]
Join Our Telegram Group
")


