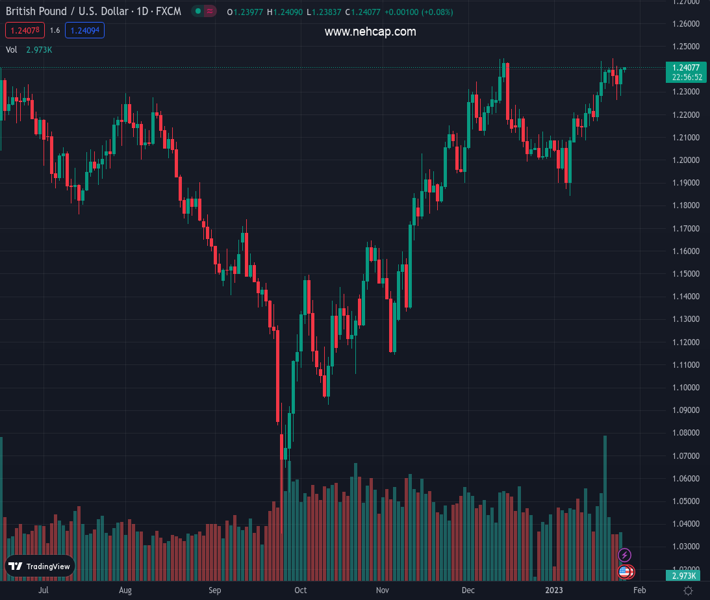
#GBPUSD @ 1.24090 The daily chart portrays that the is still upward biased. (Pivot Orderbook analysis)
…
This is a premium post.
[s2If !current_user_can(access_s2member_level4)]Please register for PREMIUM VERSION HERE to read full post below containing analysis. In case of any error or you think you are not able to read the full post below, please email us at support#nehcap.com [lwa][/s2If] [s2If current_user_can(access_s2member_level4)]
- The daily chart portrays that the GBP/USD is still upward biased.
- Short term, the GBP/USD breaking a downslope trendline paved the way for further upside.
- GBP/USD Price Analysis: Intraday speaking, a test of 1.2400 is on the cards, followed by 1.2440.
The pair currently trades last at 1.24090.
The previous day high was 1.2414 while the previous day low was 1.2263. The daily 38.2% Fib levels comes at 1.2321, expected to provide support. Similarly, the daily 61.8% fib level is at 1.2356, expected to provide support.
The GBP/USD is trading almost flat as the Asian Pacific session begins. On Wednesday, the GBP/USD closed on a higher note, up by a half percent (0.50%), but fell short of achieving a daily close at 1.2400. Nevertheless, the uptrend remains intact, and the GBP/USD exchanges hands at 1.2392, registering minimal losses of 0.04%.
From a daily chart perspective, the GBP/USD remains upward biased, with sellers failing to drag prices below the 20-day Exponential Moving Average (EMA) at 1.2254. To further extend its uptrend, GBP/USD bulls need to reclaim 1.2443, which would exacerbate a rally towards June’s high of 1.2597, shy of the 1.2600 figure.
Intraday speaking, the GBP/USD is neutral to upward biased. After breaking above a downslope resistance trendline drawn from January 23 highs, broken around 1.2370/75, opened the door to challenge the 1.2400 mark. Nonetheless, the Relative Strength Index (RSI) slope is aiming downward, which suggests that a pullback to the daily pivot point level at 1.2363 is on the cards. Following that, the GBP/USD might print a leg up towards 1.2400, followed by the R1 daily pivot at 1.2440, followed by the R2 pivot at 1.2483.
Technical Levels: Supports and Resistances
GBPUSD currently trading at 1.2394 at the time of writing. Pair opened at 1.2335 and is trading with a change of 0.48 % .
| Overview | Overview.1 | |
|---|---|---|
| 0 | Today last price | 1.2394 |
| 1 | Today Daily Change | 0.0059 |
| 2 | Today Daily Change % | 0.4800 |
| 3 | Today daily open | 1.2335 |
The pair remains strongly bullish on the daily timeframe. It trades above its 20 SMA @ 1.2174, 50 SMA 1.2132, 100 SMA @ 1.1741 and 200 SMA @ 1.1972.
| Trends | Trends.1 | |
|---|---|---|
| 0 | Daily SMA20 | 1.2174 |
| 1 | Daily SMA50 | 1.2132 |
| 2 | Daily SMA100 | 1.1741 |
| 3 | Daily SMA200 | 1.1972 |
The previous day high was 1.2414 while the previous day low was 1.2263. The daily 38.2% Fib levels comes at 1.2321, expected to provide support. Similarly, the daily 61.8% fib level is at 1.2356, expected to provide support.
Note the levels of interest below:
- Pivot support is noted at 1.2261, 1.2187, 1.211
- Pivot resistance is noted at 1.2412, 1.2488, 1.2562
| Levels | Levels.1 |
|---|---|
| Previous Daily High | 1.2414 |
| Previous Daily Low | 1.2263 |
| Previous Weekly High | 1.2436 |
| Previous Weekly Low | 1.2169 |
| Previous Monthly High | 1.2447 |
| Previous Monthly Low | 1.1992 |
| Daily Fibonacci 38.2% | 1.2321 |
| Daily Fibonacci 61.8% | 1.2356 |
| Daily Pivot Point S1 | 1.2261 |
| Daily Pivot Point S2 | 1.2187 |
| Daily Pivot Point S3 | 1.2110 |
| Daily Pivot Point R1 | 1.2412 |
| Daily Pivot Point R2 | 1.2488 |
| Daily Pivot Point R3 | 1.2562 |
[/s2If]
Join Our Telegram Group
")


