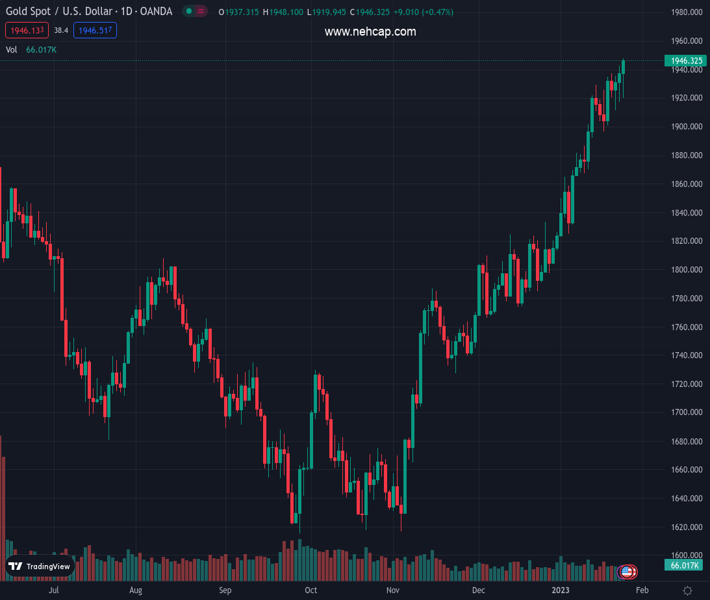
#XAUUSD @ 1,946.11 Gold price is looking to test the $1,950.00 resistance amid volatility in the USD Index. (Pivot Orderbook analysis)
…
This is a premium post.
[s2If !current_user_can(access_s2member_level4)]Please register for PREMIUM VERSION HERE to read full post below containing analysis. In case of any error or you think you are not able to read the full post below, please email us at support#nehcap.com [lwa][/s2If] [s2If current_user_can(access_s2member_level4)]
- Gold price is looking to test the $1,950.00 resistance amid volatility in the USD Index.
- A pause in BoC’s policy tightening conveys that major central banks are near to the terminal rate.
- More-than-projected contraction in the US Q4 GDP might accelerate recession fears.
The pair currently trades last at 1946.11.
The previous day high was 1942.57 while the previous day low was 1917.19. The daily 38.2% Fib levels comes at 1932.87, expected to provide support. Similarly, the daily 61.8% fib level is at 1926.89, expected to provide support.
Gold price (XAU/USD) is aiming to test the $1,950.00 resistance for the first time in the past nine months as the US Dollar Index has faced immense pressure. The precious metal displayed a vertical rally after dropping to near $1,920.00amid rising hopes that the Federal Reserve (Fed) has no other option than to announce a smaller interest rate hike ahead. Also, a pause announced in the policy tightening by the Bank of Canada (BoC) has conveyed a message that major central banks have reached to the terminal rate.
The US Dollar Index (DXY) has dropped to near seven-month low of around 101.20 and a downside break will trigger massive selling from the market participants. S&P managed to recover losses, portrayed optimism in the market and dips are being capitalized as a buying opportunity in the risk-perceived assets by the market participants. The 10-year US Treasury yields dropped to 3.44%.
For further guidance, investors will keep an eye on the release of the preliminary United States Gross Domestic Product (GDP) data for the fourth quarter of CY2022. As per the projections, the annualized GDP is seen lower at 2.6% vs. the prior release of 3.2%. An expression of a contraction in overall economic activities might accelerate recession fears on a broader basis.
Gold price is in a strong uptrend forming higher highs and higher lows on a daily scale. The precious metal has witnessed three consecutive buying tails, which indicates that the market participants are buying the dips with immense interest. On a broader note, horizontal support plotted from June 13 high at $1,879.26 will be a cushion for the Gold price.
The 10-and 20-period Exponential Moving Averages (EMAs) at $1,924.74 and $1,895.26 respectively are aiming higher, which signals more upside ahead.
Also, the Relative Strength Index (RSI) (14) is oscillating in a bullish range of 60.00-80.00, which indicates that the bullish momentum is active.
Technical Levels: Supports and Resistances
XAUUSD currently trading at 1945.96 at the time of writing. Pair opened at 1937.95 and is trading with a change of 0.41 % .
| Overview | Overview.1 | |
|---|---|---|
| 0 | Today last price | 1945.96 |
| 1 | Today Daily Change | 8.01 |
| 2 | Today Daily Change % | 0.41 |
| 3 | Today daily open | 1937.95 |
The pair remains strongly bullish on the daily timeframe. It trades above its 20 SMA @ 1878.11, 50 SMA 1818.87, 100 SMA @ 1748.69 and 200 SMA @ 1775.67.
| Trends | Trends.1 | |
|---|---|---|
| 0 | Daily SMA20 | 1878.11 |
| 1 | Daily SMA50 | 1818.87 |
| 2 | Daily SMA100 | 1748.69 |
| 3 | Daily SMA200 | 1775.67 |
The previous day high was 1942.57 while the previous day low was 1917.19. The daily 38.2% Fib levels comes at 1932.87, expected to provide support. Similarly, the daily 61.8% fib level is at 1926.89, expected to provide support.
Note the levels of interest below:
- Pivot support is noted at 1922.57, 1907.19, 1897.19
- Pivot resistance is noted at 1947.95, 1957.95, 1973.33
| Levels | Levels.1 |
|---|---|
| Previous Daily High | 1942.57 |
| Previous Daily Low | 1917.19 |
| Previous Weekly High | 1937.57 |
| Previous Weekly Low | 1896.63 |
| Previous Monthly High | 1833.38 |
| Previous Monthly Low | 1765.89 |
| Daily Fibonacci 38.2% | 1932.87 |
| Daily Fibonacci 61.8% | 1926.89 |
| Daily Pivot Point S1 | 1922.57 |
| Daily Pivot Point S2 | 1907.19 |
| Daily Pivot Point S3 | 1897.19 |
| Daily Pivot Point R1 | 1947.95 |
| Daily Pivot Point R2 | 1957.95 |
| Daily Pivot Point R3 | 1973.33 |
[/s2If]
Join Our Telegram Group
")


