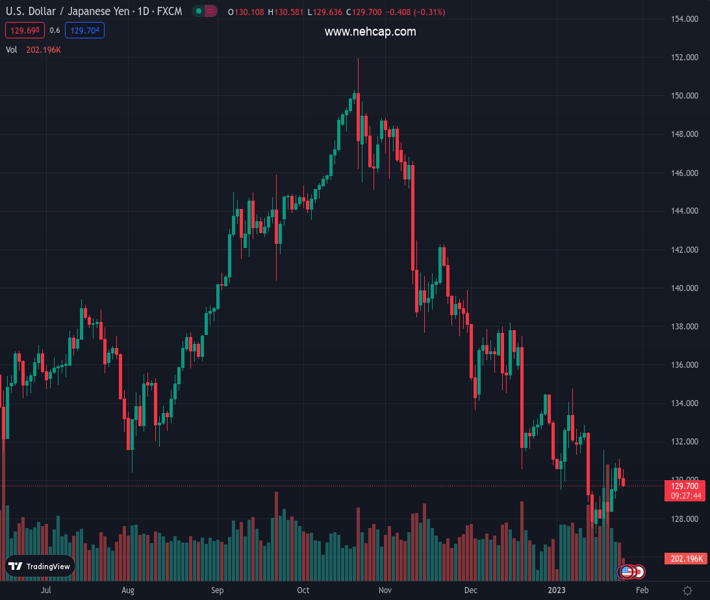
#USDJPY @ 129.730 drift into negative territory for the second straight day amid reviving safe-haven demand. (Pivot Orderbook analysis)
…
This is a premium post.
[s2If !current_user_can(access_s2member_level4)]Please register for PREMIUM VERSION HERE to read full post below containing analysis. In case of any error or you think you are not able to read the full post below, please email us at support#nehcap.com [lwa][/s2If] [s2If current_user_can(access_s2member_level4)]
- USD/JPY drift into negative territory for the second straight day amid reviving safe-haven demand.
- Looming recession risks weigh on investors’ sentiment and drive some haven flows towards the JPY.
- A modest pickup in the USD demand could lend support and help limit the downside for the major.
The pair currently trades last at 129.730.
The previous day high was 131.12 while the previous day low was 129.73. The daily 38.2% Fib levels comes at 130.26, expected to provide resistance. Similarly, the daily 61.8% fib level is at 130.58, expected to provide resistance.
The USD/JPY pair attracts some sellers near the 130.60 area and turns lower for the second successive day on Wednesday. The pair maintains its offered tone heading into the North American session and is currently placed near the daily low, around the 129.75-129.70 region.
A combination of factors provides a modest lift to the Japanese Yen, which, in turn, is seen exerting some downward pressure on the USD/JPY pair. Despite the Bank of Japan’s (BoJ) dovish decision last week, market participants seem convinced that high inflation may invite a more hawkish stance from the central bank later this year. Apart from this, a fresh wave of the global risk-aversion trade benefits the JPY’s relative safe-haven status.
The market sentiment remains fragile amid looming recession risks, fueled by worries about the economic headwinds stemming from the worst yet COVID-19 outbreak in China and the protracted Russia-Ukraine war. Moreover, the latest report by World Bank noted that the global economy is now in its steepest slowdown following a post-recession recovery since 1970. This, in turn, is seen weighing on investors’ sentiment and driving some haven flow to the JPY.
The global flight to safety, meanwhile, assists the US Dollar to gain some positive traction and move away from a nine-month low. This could lend some support to the USD/JPY pair and help limit deeper losses. Traders might also refrain from placing aggressive bets ahead of this week’s important US macro releases, which might influence the Fed’s rate-hiking cycle. This will drive the USD demand and provide a fresh directional impetus to the major.
In the meantime, the broader market risk sentiment, along with the USD price dynamics, will be looked upon to grab short-term opportunities around the USD/JPY pair in the absence of any relevant macro data from the US. Nevertheless, the recent price action and the fundamental backdrop suggest that the recent bearish trend might still be far from being over. Hence, any attempted recovery move could get sold into and remain limited, for the time being.
Technical Levels: Supports and Resistances
USDJPY currently trading at 129.79 at the time of writing. Pair opened at 130.16 and is trading with a change of -0.28 % .
| Overview | Overview.1 | |
|---|---|---|
| 0 | Today last price | 129.79 |
| 1 | Today Daily Change | -0.37 |
| 2 | Today Daily Change % | -0.28 |
| 3 | Today daily open | 130.16 |
The pair remains strongly bearish on the daily time frame. It trades below the 20 SMA @ 130.84, 50 SMA 134.44, 100 SMA @ 139.87 and 200 SMA @ 136.74.
| Trends | Trends.1 | |
|---|---|---|
| 0 | Daily SMA20 | 130.84 |
| 1 | Daily SMA50 | 134.44 |
| 2 | Daily SMA100 | 139.87 |
| 3 | Daily SMA200 | 136.74 |
The previous day high was 131.12 while the previous day low was 129.73. The daily 38.2% Fib levels comes at 130.26, expected to provide resistance. Similarly, the daily 61.8% fib level is at 130.58, expected to provide resistance.
Note the levels of interest below:
- Pivot support is noted at 129.55, 128.94, 128.16
- Pivot resistance is noted at 130.94, 131.72, 132.33
| Levels | Levels.1 |
|---|---|
| Previous Daily High | 131.12 |
| Previous Daily Low | 129.73 |
| Previous Weekly High | 131.58 |
| Previous Weekly Low | 127.22 |
| Previous Monthly High | 138.18 |
| Previous Monthly Low | 130.57 |
| Daily Fibonacci 38.2% | 130.26 |
| Daily Fibonacci 61.8% | 130.58 |
| Daily Pivot Point S1 | 129.55 |
| Daily Pivot Point S2 | 128.94 |
| Daily Pivot Point S3 | 128.16 |
| Daily Pivot Point R1 | 130.94 |
| Daily Pivot Point R2 | 131.72 |
| Daily Pivot Point R3 | 132.33 |
[/s2If]
Join Our Telegram Group
")


